International Journal of Environmental Pollution and Remediation (IJEPR)
ISSN: 1929-2732

Volume 13 - Year 2025 - Pages 36-46
DOI: 10.11159/ijepr.2025.005
Assessing the Effects of Agricultural Management on GHG Emissions using an Integrated DNDC–LCA Approach
Hafiz Muhammad Hasnain Shah1, Zunaira Asif2*
1University of Engineering and Technology, Lahore,
G.T. Road, Lahore, Punjab, Pakistan
Hasnain.en13@gmail.com
2University of New Brunswick, Department of Engineering,
100 Tucker Park Rd, Saint John, NB, Canada
Zunaira.asif@unb.ca
Abstract - Agricultural activities contribute significantly to global greenhouse gas (GHG) emissions, making mitigation in cropping systems critical for climate sustainability. This study establishes a robust framework by integrating process-based modeling using the DeNitrification–DeComposition (DNDC) model with a Life Cycle Assessment (LCA) approach to evaluate GHG emissions from corn production. The DNDC model simulates soil nitrous oxide (N₂O) and carbon dioxide (CO₂) fluxes under varying nitrogen management strategies, including urea and urea ammonium nitrate (UAN) applied at different rates and as split applications, while accounting for soil organic carbon (SOC) levels and residue management practices. The LCA combines DNDC-derived soil fluxes with upstream emissions from fertilizer and seed production, field operations, and transportation to provide a cradle-to-farm gate assessment. In contrast to studies dependent entirely on empirical emission factors, this innovative DNDC–LCA framework captures site-specific soil dynamics while linking them to the broader production system, offering a mechanistic and comprehensive evaluation of mitigation strategies. Results show that higher nitrogen application rates substantially increase both fertilizer-related and soil N₂O emissions, with cumulative emissions reaching 2.54 kg N₂O-N ha⁻¹ for urea and 2.40 kg N₂O-N ha⁻¹ for UAN at the highest rate, while split applications reduced emissions to 1.53 kg N₂O-N ha⁻¹ (urea) and 1.45 kg N₂O-N ha⁻¹ (UAN). UAN consistently produces slightly lower emissions than urea. Residue management influences CO₂ fluxes, with aerobic practices such as residue removal or composting reducing emissions in high SOC soils. Sensitivity analysis identifies soil emissions as the dominant contributor to variability, highlighting the importance of site-specific management and accurate emission factor estimation. Comparison with field measurements shows CO₂ emissions are more predictable (R² = 0.62) than N₂O (R² = 0.46). These findings demonstrate that integrated nitrogen and residue management, coupled with attention to soil carbon dynamics, can reduce the carbon footprint of corn production while maintaining productivity. The innovative DNDC–LCA framework establishes a scientific basis to support evidence-based policies that incentivize split nitrogen application, promote lower-emission fertilizer choices, and support sustainable residue management, and provides farmers with practical strategies to reduce emissions without compromising yields.
Keywords: Greenhouse gases, Life cycle, Agriculture, Nitrogen management, Denitrification and Decomposition model.
© Copyright 2025 Authors - This is an Open Access article published under the Creative Commons Attribution License terms. Unrestricted use, distribution, and reproduction in any medium are permitted, provided the original work is properly cited.
Date Received: 2025-05-29
Date Revised: 2024-08-28
Date Accepted: 2025-09-12
Date Published: 2025-10-06
1. Introduction
Agriculture remains a major source of global greenhouse gas (GHG) emissions, with Canadian agricultural activities contributing approximately 55 megatons of carbon dioxide equivalent in 2020, accounting for about 7 to 8 percent of the nation’s total emissions [1]. Within this sector, emissions primarily arise from nitrogen cycling processes associated with fertilizer use, land management, and livestock production. The growing global demand for food production, combined with increasingly stringent environmental regulations, underscores the urgent need for sustainable agricultural practices that reduce GHG emissions while maintaining crop productivity.
Nitrous oxide (N₂O), a potent GHG with a global warming potential nearly 300 times greater than carbon dioxide over a 100-year horizon, is largely emitted through nitrogen fertilizer applications in cropping systems. Key management practices, including fertilizer formulation, application timing, tillage intensity, and irrigation, strongly influence soil nitrogen transformations and the resulting N₂O emissions [1], [2]. Optimizing fertilizer management is therefore critical for reducing N₂O emissions without compromising yields.
Recent analyses of Canadian corn production systems have shown that adopting enhanced-efficiency fertilizers, adjusting application rates, and modifying application timing can significantly reduce GHG emissions [3], [4]. However, variability in soil properties, climatic conditions, and management practices creates challenges in accurately assessing the effectiveness of these strategies across different production systems.
This study addresses these challenges by implementing an integrated methodological framework that combines life cycle assessment, process-based biogeochemical modeling, and in situ measurement techniques. This approach enables a comprehensive evaluation of how different fertilizer types, soil organic carbon and residue management scenarios influence GHG emissions in corn production systems, providing data-driven insights to guide the development of targeted and effective mitigation strategies.
2. Related Work
Life cycle assessment (LCA) provides valuable insights into emission sources and resource-use inefficiencies, helping to identify effective mitigation strategies tailored to specific cropping systems [5], [6]. However, many LCA studies rely on generic emission factors that do not fully capture the variability in emissions associated with different fertilizer types or management practices. This limitation can reduce the reliability of LCA results, especially when applied to region- or crop-specific scenarios [7],[8]. Recent research increasingly focuses on integrating detailed agronomic data and refining emission coefficients to better represent diverse farming conditions [8]-[10].
To address these limitations, process-based biogeochemical models have become essential tools. These models simulate soil nitrogen transformations and greenhouse gas (GHG) emissions by representing the underlying biological and chemical processes. Commonly used models include CENTURY, DayCent, the DeNitrification-DeComposition (DNDC) model, and the Environmental Policy Integrated Climate (EPIC) model [11]-[13]. Among these, the DNDC model is valued for its detailed representation of nitrogen cycling, ability to estimate multiple GHGs, and adaptability to a wide range of fertilizer management practices [14], [15]. When combined with LCA frameworks, these models enable more dynamic and accurate environmental impact assessments that reflect site- and management-specific conditions [10], [16].
Evaluating nitrogen management techniques also requires considering their impact on crop yields, since yield outcomes strongly influence farmer adoption. Some mitigation strategies may reduce nitrous oxide (N₂O) emissions but lower yields, while others can reduce emissions without affecting or even improving productivity [17], [18]. The effectiveness of these practices depends on crop type, soil characteristics, and local conditions. Corn production presents challenges for accurate N₂O quantification due to complex nitrogen cycling dynamics and diverse management approaches. These systems often combine multiple practices that interact in ways that affect both emissions and yields [16],[19]. However, systematic assessments of combined practices remain limited because of logistical and financial constraints [20]. For example, in corn systems, nitrogen application timing is often linked with specific fertilizer types and methods, such as broadcasting and incorporating granular fertilizers at planting or applying liquid urea ammonium nitrate as side dress injections or bands. These interlinked practices make both emissions measurement and model calibration more complex [21].
Direct field measurements, including static chambers and eddy covariance systems, continue to provide critical emissions data but are constrained by high costs, limited spatial coverage, and labour intensity [22]. Combining empirical measurements with process-based modeling and LCA offers a more comprehensive approach for assessing GHG mitigation strategies across different scales and farming contexts [10], [16]. This integrated approach supports informed decision-making for nitrogen management strategies that balance environmental sustainability with agricultural productivity [13], [14]. Although many studies assess individual practices, real-world farming often involves multiple, interrelated techniques, underscoring the need for more holistic, systems-level analyses.
3. Methodology
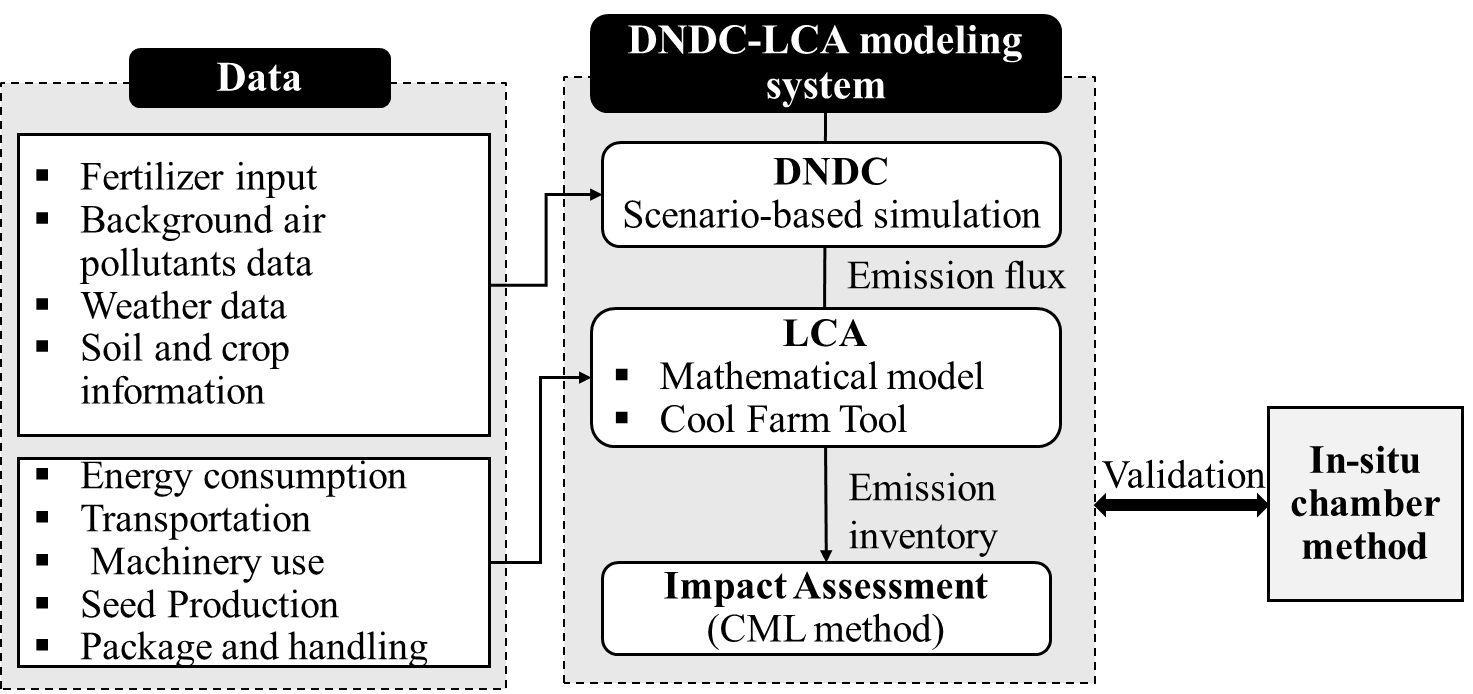
This study employed the DeNitrification-DeComposition (DNDC) model to simulate soil greenhouse gas (GHG) emissions under various nitrogen management strategies in corn production. Using site-specific data on soil characteristics, weather conditions, crop management, and fertilizer applications, DNDC generated detailed estimates of nitrous oxide, methane, and carbon dioxide fluxes driven by soil biogeochemical processes. These process-based emission outputs were then integrated into a Life Cycle Assessment (LCA) framework following ISO 14040 and 14044 standards. The LCA process included goal and scope definition, system boundary specification, life cycle inventory (LCI) compilation, impact assessment, and interpretation of results, as illustrated in Figure 1.
By replacing generic emission factors with DNDC-derived soil emissions, the LCA provided a more accurate evaluation of both direct and indirect emissions, including those associated with fertilizer production, energy use, and field operations. “The Cool Farm Tool (CFT)” platform was used to assess multiple nitrogen and residue management scenarios. Model outputs were validated by comparing the simulated results with field measurements collected using in-situ static chambers and analyzed via gas chromatography. This integrated modeling–LCA approach enabled a comprehensive assessment of GHG mitigation potential while capturing the site- and management-specific dynamics of soil emissions.
3.1 Site Selection
This study was conducted on a representative corn field, designated Location A, in eastern Canada. The region is characterized by fertile, well-drained loam soils, a humid continental climate, moderate summer temperatures averaging 18–22 °C, and annual precipitation of approximately 1,000–1,400 mm, distributed relatively evenly throughout the growing season. The site has a growing season of about 120–140 days, supporting consistent corn production. Location A was selected for its typical management practices, including the application of synthetic fertilizers, periodic pesticide use, and conventional tillage, which are representative of commercial corn production systems in the region. Data from a 1.4-hectare plot were collected to parameterize the DNDC model and to generate a life cycle inventory for integration into the LCA framework.
3.2 DeNitrification-DeComposition (DNDC) Model
The DeNitrification-DeComposition (DNDC) model is a process-based framework designed to simulate carbon (C) and nitrogen (N) dynamics in agricultural ecosystems [14]. It is widely used to estimate greenhouse gas (GHG) emissions, crop growth, and soil C and N transformations under varying management practices and environmental conditions. DNDC consists of two primary components: the first includes soil, climate, and crop sub-models, which rely on key ecological drivers, i.e., climate, soil characteristics, and management practices. The second component simulates nitrification and denitrification processes, estimating trace gas fluxes from the plant–soil system based on the prevailing soil environmental conditions.
3.3 Data Collection and Inputs
Environmental and operational data were compiled from field measurements, surveys, and established databases to support the life cycle inventory development. (1) Meteorological data were collected using Aeroqual sensors installed at multiple locations across the site to capture spatial variability in temperature, humidity, wind speed, rainfall, and barometric pressure. (2) Soil parameters, including temperature (°C) and volumetric moisture content (m³/m³), were monitored using HOBO MX2307 data loggers. (3) Management practices, such as tillage intensity, irrigation schedules, and pest control measures, were documented through structured farm surveys. Fertilizer information, including type and application method, was obtained from local market sources and directly from on-farm records, as these inputs play a critical role in determining nitrous oxide (N₂O) emissions. (4) Emission factors for upstream processes, including fertilizer manufacturing, seed production, transportation, and electricity generation, were sourced from the Ecoinvent 3.9 database and supplemented with values from relevant literature [13], [15]. Table 1 lists the main climate, soil, and management inputs used in the DNDC model for Site A.
Table 1. Key DNDC model inputs for the selected site A
|
Input Category |
Parameters |
Values |
|
Climate Data |
Background CO2 |
100–510 ppm |
|
Background NH3 |
0.4–1.4 ppm |
|
|
Soil properties |
pH |
6.1–7.4 |
|
Moisture |
0.2–0.35 m3/m3 |
|
|
Management |
Land usage |
cropland |
|
Fertilizer type |
(urea, urea ammonium nitrate) |
|
|
Application rate |
(1 or 2; 2 for split applications) |
|
|
Method of application |
Surface broadcasts for all four scenarios |
|
|
Use of Inhibitor |
Yes |
|
|
Manure input |
Poultry: 0.3; C:N<15: 0.2–0.3 |
3.4 Life Cycle Assessment Model
3.4.1. Define System Boundaries and Subsystems
The study adopted a cradle-to-farm gate system boundary, which included three main life cycle stages: (a) Input production, encompassing the manufacturing of seeds, fertilizers, and fuels; (b) On-farm activities, such as soil preparation, planting, fertilization, irrigation, pest control, and harvesting; and (c) Transportation, restricted to on-farm movements and immediate post-harvest logistics. The functional unit was set as the cultivation of 1.4 hectares of corn, enabling consistent comparisons across different nitrogen management scenarios and system configurations. All greenhouse gas (GHG) emissions were expressed as CO₂ equivalents and standardized based on this functional unit.
3.4.2. Life Cycle Inventory Model
The relationship between agricultural inputs and greenhouse gas emissions was represented using a matrix-based linear system [23]:
A⋅ I= E (1)
whereas: “A” is a matrix of emission coefficients, each representing the emission rate associated with a specific input or process. “I” is the vector of inputs (e.g., soil type, fertilizers, energy use, and farming practices). “E” is the vector of GHG emissions (e.g., CO₂, N₂O, CH₄).
Using an inverse matrix method, the equation for E (GHG emissions) was solved as follows:
I=A−1 ⋅ E (2)
Here, A⁻1; is the inverse of the matrix A and allows us to determine the specific GHG emissions (CO₂, CH₄, N₂O) based on the inputs provided. This method facilitated scenario-based modeling, allowing the emissions associated with each fertilizer type and application strategy to be assessed independently.
3.4.3. Environmental Impact Assessment
The environmental impact assessment in this study was performed using the CML-Impact Assessment (CML-IA) baseline 2016 methodology, which employs a midpoint-oriented approach to quantify specific environmental mechanisms, including climate change, eutrophication, acidification, and toxicity. The impact categories considered were global warming potential (GWP, 100-year horizon), eutrophication potential (EP), acidification potential (AP), human toxicity potential (HTP), and ecotoxicity potential (ETP). Life cycle inventory (LCI) data on emissions and resource use were translated into equivalent environmental burdens using the characterization factors provided by the CML-IA 2016 framework, for example, kg CO₂-equivalents (CO₂-eq) for GWP and kg PO₄³⁻-equivalents for EP [23].
To enable comparisons across impact categories and agricultural activities, results were normalized using regional normalization factors, which represent the average per capita environmental load. This normalization converts the characterized impact values into unitless scores, facilitating direct comparison of the relative magnitude of different environmental impacts and supporting an integrated assessment of trade-offs among climate, ecosystem, and human health domains.
For a more detailed evaluation of climate-related emissions, GWP was also calculated specifically over a 100-year time horizon using the characterization factors: CO₂ = 1, CH₄ = 25, and N₂O = 298. Total climate impact was calculated as [7], [23]:
Impact =∑ (Gi × GWP of gas) (3)
Where Gi represents the quantity of each emitted gas, and GWP is its associated global warming potential. This enabled a direct comparison of nitrogen management strategies in terms of their contributions to climate change.
3.5 Decision Support Tool
The Cool Farm Tool (CFT) was used as a decision-support tool to estimate greenhouse gas (GHG) emissions from corn production under different nitrogen management strategies. This farm-level calculator relies on activity-based inputs, including fertilizer type and application rate, soil properties, tillage practices, and climatic variables, to estimate both direct and indirect emissions of CO₂, CH₄, and N₂O. The tool is based on IPCC Tier 1 and Tier 2 methodologies, which use default and region-specific emission factors, respectively and considers emissions from soil processes, input production, on-farm energy use, and crop residue management. By modeling multiple nitrogen input scenarios, the CFT enabled the comparison of total GHG emissions across alternative fertilization practices. Its integrated algorithms and emission factors, validated in peer-reviewed studies, allow for simulation of management- and site-specific emission outcomes, making it a practical tool for evaluating mitigation options in crop production systems.
3.6 In-situ Field Data
Greenhouse gas (GHG) samples were collected from static chambers installed in the soil using collars, with the primary purpose of validating model predictions. The chambers, 20 cm in height and 20–30 cm in diameter, were equipped with a sampling port, vent tube, and temperature sensor, ensuring an airtight environment. Reflective shields were used to reduce heat accumulation. Key measurements recorded included gas concentrations, chamber volume, temperature, and pressure, allowing precise calculation of GHGs flux. Gas samples were subsequently analyzed using gas chromatography.
3.7 Statistical Analysis
The DNDC model was calibrated and validated using field-measured N₂O and CO₂ fluxes collected from Site A. Calibration involved adjusting key soil and management parameters (e.g., soil organic carbon content and fertilizer application rates) within ranges reported in the literature to improve the agreement between simulated and observed fluxes. Validation was then performed using independent subsets of field data not applied during calibration.
Statistical analyses were conducted in R version 4.5.1. Model performance was evaluated using several statistical indicators. The correlation coefficient (R) measures the strength and direction of association between observed and simulated values, with values closer to ±1 indicating stronger relationships. The coefficient of determination (R²) represents the proportion of variance in observations explained by the model; values closer to 1.0 indicate better performance. In field-scale GHG studies, R² < 0.5 indicates fair to weak explanatory power, R² = 0.5–0.7 indicates moderate explanatory power, and R² > 0.7 indicates strong explanatory power. The standard error (SE) reflects the average deviation between predictions and observations, with lower values denoting higher accuracy. The p-value tests the statistical significance of the model–data relationship, where p < 0.05 indicates significant agreement.
Sensitivity analysis was performed using Spearman’s rank correlation coefficients (θ) to quantify the relative influence of input parameters on simulated GHG fluxes, with θ values approaching 1 indicating stronger monotonic relationships.
4. Results
4.1 Evaluation of Nitrogen Management and DNDC Simulation Scenarios
Two nitrogen fertilizers, i.e., urea (46% N) and urea ammonium nitrate (UAN, 30% N) were selected to generate simulations. Fertilizer applications were expressed as kg N ha⁻¹ for direct comparison. Five DNDC simulation scenarios were run to estimate cumulative N₂O emissions over a 90-day growing period: (a) Control: No N applied, (b) N25: 25 kg N ha⁻¹, (c) N100: 100 kg N ha⁻¹, (d) N150: 150 kg N ha⁻¹ and (e) Split: 100 kg N ha⁻¹ applied in two equal splits. Figure 2 illustrates cumulative N₂O emissions for urea and UAN across different nitrogen management scenarios.
Baseline emissions in the control (no fertilizer) scenario were 1.21 kg N₂O-N ha⁻¹, representing natural soil processes. Emissions increased with higher nitrogen rates for both fertilizers: N25 resulted in 1.70 kg N₂O-N ha⁻¹ for urea and 1.63 kg N₂O-N ha⁻¹ for UAN, N100 reached 1.99 kg N₂O-N ha⁻¹ (urea) and 1.88 kg N₂O-N ha⁻¹(UAN), and N150 produced the highest emissions at 2.54 kg N₂O-N ha⁻¹ (urea) and 2.40 kg N₂O-N ha⁻¹ (UAN). These trends reflect increased nitrification and denitrification with higher soil nitrogen availability, moisture, and microbial activity [24], and indicate reduced nitrogen use efficiency at the highest N rate [25].
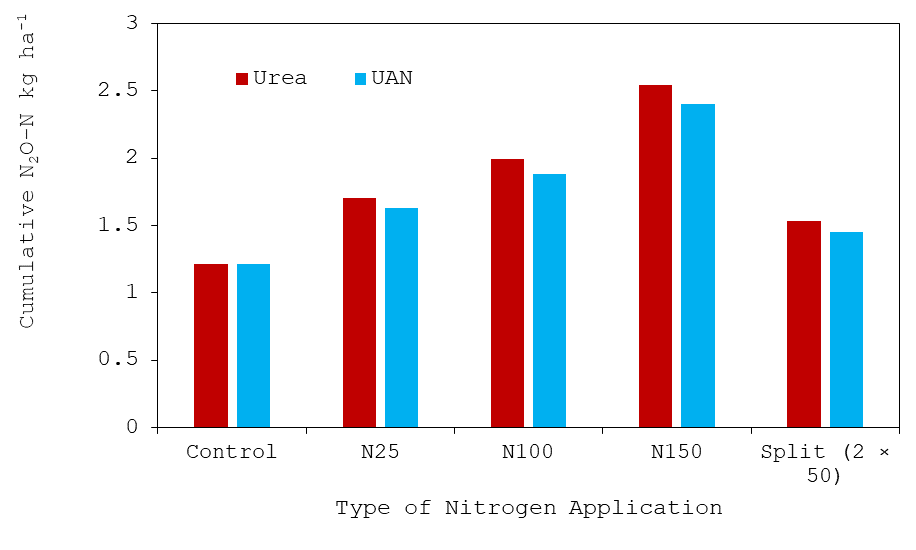
The split application (2 × 50 kg N ha⁻¹) lowered cumulative emissions to 1.53 kg N₂O-N ha⁻¹ for urea and 1.45 kg N₂O-N ha⁻¹ for UAN. This demonstrates that dividing nitrogen inputs reduces peak soil N concentrations, mitigating N₂O emissions by enhancing plant uptake and reducing denitrification losses. Overall, UAN consistently produced slightly lower emissions than urea at equivalent N rates, which aligns with previous studies showing that banded UAN applications reduce N₂O emissions relative to urea by minimizing volatilization and improving nitrogen use efficiency [26], [27]. These results highlight the potential of UAN as a more climate-smart nitrogen fertilizer in corn production systems.
4.2 Influence of Soil Organic Carbon on CO2 flux
The results in Table 2 present simulated soil CO₂ fluxes under varying soil organic carbon (SOC) levels and UAN fertilizer applications using the DNDC model. At a baseline SOC of 0.02 kg C kg⁻¹ soil, CO₂ fluxes ranged from 0.06 to 3.2 Mg C ha⁻¹, depending on nitrogen application rates. When SOC was increased to 0.03 kg C kg⁻¹ soil, fluxes rose to 0.1–3.8 Mg C ha⁻¹, indicating that higher SOC levels enhance microbial decomposition and, consequently, CO₂ emissions.
This trend reflects the well-documented relationship between SOC availability and soil respiration; whereby elevated organic carbon stimulates microbial activity and accelerates decomposition processes [28]. The effect was particularly evident in higher nitrogen input scenarios (N100 and N150), where UAN applications in SOC-enriched soils produced the greatest CO₂ fluxes. These findings suggest that both SOC content and fertilizer rate interact to regulate soil carbon dynamics, highlighting the importance of balanced N management in carbon-rich soils.
Table 2. CO2 flux values based on different SOC and treatment scenarios for corn crop (Site A)
|
Application type |
SOC (kg C/kg of Soil) |
|
|
0.02 |
0.03 |
|
|
Units |
CO2 flux (Mg C per ha) |
CO2 flux (Mg C per ha) |
|
No treatment |
0.06−1.5 |
0.4−1.8 |
|
N25 |
0.09−1.2 |
0.2−1.5 |
|
N100 |
0.92−2 |
1.2−2.5 |
|
N150 |
1.4−3.2 |
1.7−3.8 |
|
Split treatment |
0.87−1.7 |
1.1−2.0 |
4.3 Life Cycle Emission Inventory
GHG emissions were normalized per ton of corn (total 3,164.25 kg CO₂e/ton) to allow direct comparison across life-cycle stages. Table 3 presents the percentage distribution of GHG emissions across pre-production, in-field, and post-production activities at Site A.
Table 3. GHG emission inventory by life-cycle stage for corn production at Site A.
|
Life cycle stage |
Activities |
Emissions (kg CO₂e / ton corn) |
|
Pre-Production |
Fertilizer Production |
251.9 |
|
Seed Production |
1971.1 |
|
|
Diesel usage |
53.6 |
|
|
Electricity usage |
2.8 |
|
|
Transportation |
16.1 |
|
|
In Field |
Soil CO₂ flux |
529.95 |
|
Soil N₂O flux |
54.59 |
|
|
Residue management |
96.87 |
|
|
Irrigation (pumping) |
5.78 |
|
|
Field machinery use |
8.67 |
|
|
Pre-Production/In-Field |
Pesticide & herbicide |
2.89 |
|
Post-production |
Post-harvest handling |
70 |
|
Packaging |
100 |
Pre-production dominated the footprint, accounting for approximately 72% of total emissions, with seed production (1,971.1 kg CO₂e/ton; 62.3%) and fertilizer manufacture (251.9 kg CO₂e/ton; 8.0%) as the largest contributors. Diesel use (~20 L/ton; 53.6 kg CO₂e/ton; 1.7%), electricity consumption (15 kWh/ton; 2.8 kg CO₂e/ton; 0.09%), and 50 km transportation (16.1 kg CO₂e/ton; 0.51%) added further emissions. In-field emissions contributed roughly 22% of the total, including soil CO₂ flux (529.95 kg CO₂e/ton; 16.7%), N₂O (54.59 kg CO₂e/ton; 1.7%), residue management (96.87 kg CO₂e/ton; 3.1%), irrigation (5.78 kg CO₂e/ton; 0.18%), field machinery (8.67 kg CO₂e/ton; 0.27%), and pesticide/herbicide application (2.89 kg CO₂e/ton; 0.09%). Post-production activities, including packaging (100 kg CO₂e/ton; 3.2%) and post-harvest handling (70 kg CO₂e/ton; 2.2%), accounted for the remaining ~5% of total emissions. Overall, pre-production inputs represent the largest share of the carbon footprint, emphasizing seed production and fertilizer manufacture as key mitigation targets, while in-field and post-production stages contribute smaller but still relevant shares.
4.4 GHGs and Residue Management
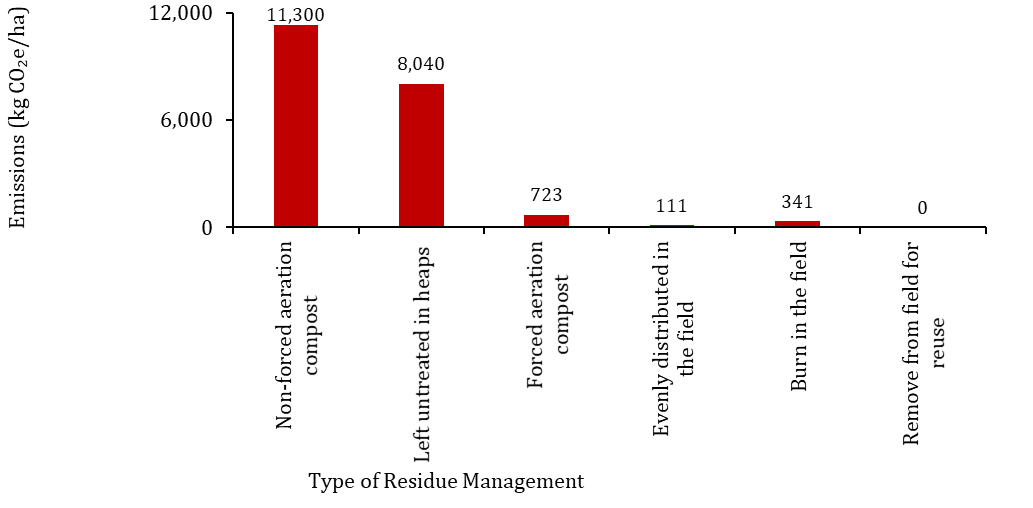
Residue management is a key factor influencing on-farm greenhouse gas (GHG) emissions, as post-harvest biomass can undergo aerobic or anaerobic decomposition depending on the handling method. In this study, the Cool Farm Tool was used to simulate CO₂-equivalent (CO₂e) emissions per hectare for different residue management strategies. The results, presented in Figure 3, reveal substantial variation among practices.
Removing residues from the field for reuse generated no emissions, identifying it as the most climate-friendly option. In contrast, residues removed for composting without forced aeration produced the highest emissions (11,300 kg CO₂e/ha) due to anaerobic conditions that favour methane (CH₄) and nitrous oxide (N₂O) production. Similarly, leaving residues untreated in heaps or pits resulted in 8,040 kg CO₂e/ha, also driven by anaerobic microbial activity. Maintaining aerobic conditions through forced aeration composting significantly lowered emissions to 723.44 kg CO₂e/ha. Other approaches, such as field burning (341.28 kg CO₂e/ha) or leaving residues distributed/mulched (111.28 kg CO₂e/ha), also resulted in lower emissions. These findings underscore the importance of residue management practices that minimize anaerobic decomposition to reduce agricultural GHG emissions effectively.
4.5 Environmental Impact Assessment
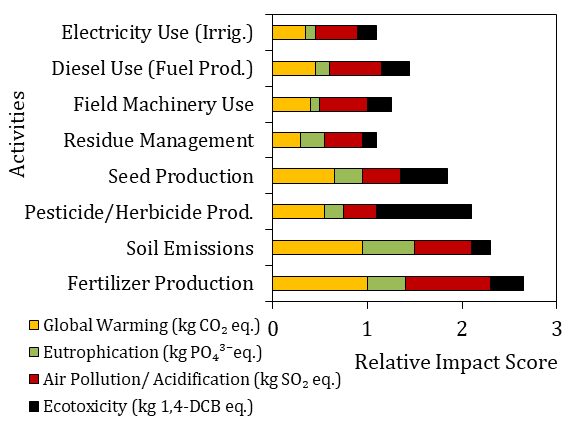
Figure 4 depicts the environmental impacts of principal agricultural operations evaluated across four major categories: global warming potential (kg carbon dioxide equivalent, kg CO₂ eq.), eutrophication (kg phosphate equivalent, kg PO₄³⁻eq.), air pollution/ acidification (kg sulphur dioxide equivalent, kg SO₂ eq.), and ecotoxicity (kg 1,4-dichlorobenzene equivalent, kg 1,4-DCB eq.).
Fertilizer production was identified as the predominant driver of global warming potential, largely due to the intensive energy consumption involved in its manufacturing processes and the resultant greenhouse gas emissions. Emissions from soils, especially nitrous oxide (N₂O), also accounted for a significant portion of the climate-related impacts, reflecting the critical role of nitrogen transformations driven by soil microbial activity. In terms of ecotoxicity, the synthesis of pesticides and herbicides exerted the most substantial influence, indicating the heightened ecological hazards these agrochemicals pose to terrestrial and aquatic ecosystems. Conversely, practices such as residue management and the use of field machinery showed comparatively moderate effects across all categories. These outcomes underscore the necessity of addressing both on-farm emissions and upstream production impacts, particularly by targeting improvements in fertilizer and pesticide manufacturing processes and implementing strategies to mitigate soil nitrogen emissions
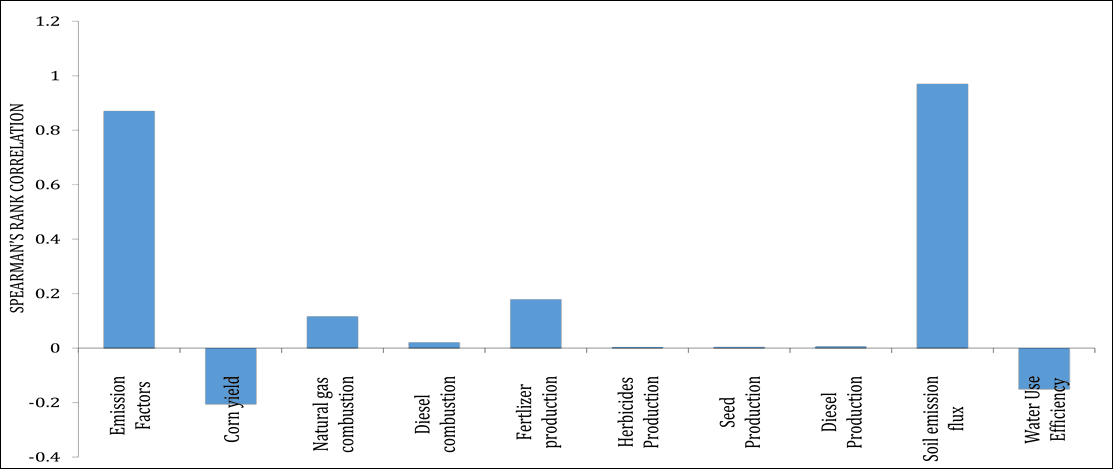
4.6 Uncertainty Analysis and Validation
To address the variability in emission factors and the heterogeneity of field management practices among farmers, Spearman correlation analysis was employed to evaluate greenhouse gas (GHG) emissions. Sensitivity analysis, based on Spearman correlation coefficients (ѳ) approaching ±1 (Figure 5), identified the parameters exerting the greatest influence on total GHG outputs.
Results indicated that yield-scaled GHG emissions were predominantly driven by soil-based emissions, highlighting the pivotal role of agricultural soils in overall emission dynamics. In particular, the emission factor associated with direct soil emissions exhibited a strong positive correlation with total GHG release (ѳ = 0.79–0.86), underscoring its status as the most influential driver of variability. By contrast, emissions linked to the production of herbicides, seeds, and diesel displayed minimal sensitivity, with very low correlation values. Fertilizer manufacturing and application rates showed moderate positive associations with total GHGs (ѳ = 0.18–0.28), reflecting their limited influence on yield-scaled emissions. These patterns emphasize the central role of soil emissions as a priority target for mitigation interventions within crop production systems. Despite incorporating detailed field-level inventory data, such as fertilizer and irrigation application rates, seed usage, travel distances, yield records, and input costs, uncertainty in emissions from soil processes persisted as the primary source of variability, marking a key limitation of the analysis.
Regression analyses were applied to evaluate the correspondence between DNDC-simulated and observed fluxes at Site A, as shown in Table 4. The correlation coefficient for N₂O fluxes was R = 0.635, indicating a moderate positive relationship between observed and modeled values, while the coefficient of determination (R² = 0.46) showed that approximately 46% of the variability in field N₂O fluxes was explained by environmental and management drivers, such as soil moisture, temperature, and fertilizer application rates. The standard error (SE = 0.21) indicated an acceptable level of prediction accuracy, and the relationship was statistically significant (p < 0.001). CO₂ fluxes, in contrast, typically exhibited stronger predictive fits (R² = 0.62), reflecting more stable and predictable emission patterns driven by soil respiration and temperature dynamics. The higher R² values for CO₂ indicate that a larger proportion of variability was captured by the model compared to N₂O, which displayed higher spatial and temporal variability due to the complexity of microbial nitrogen cycling. These results confirm that soil moisture and nitrogen inputs are strong predictors of N₂O fluxes, whereas CO₂ emissions are more closely associated with soil temperature and organic matter availability.
Table 4. Statistical evaluation of DNDC-simulated and observed fluxes at Site A.
|
Statistics |
N₂O fluxes |
CO₂ fluxes |
|
Correlation coefficient (R) |
0.635 |
0.79 |
|
R Square (R²) |
0.46 |
0.62 |
|
Adjusted R Square |
0.390 |
0.60 |
|
Standard Error |
0.208 |
0.16 |
|
P-value |
<0.001 |
<0.001 |
|
Number of observations |
50 |
50 |
5. Conclusions, Limitations, and Future Research
This study demonstrates how management practices, including nitrogen application strategies, residue handling, and soil organic carbon (SOC) dynamics, collectively influence the greenhouse gas (GHG) profile of corn production systems. The DNDC–LCA framework provides site-specific insights indicating that higher nitrogen application rates significantly increase emissions from both fertilizer manufacturing and soil-derived GHG fluxes. Among the fertilizers tested, urea ammonium nitrate (UAN) consistently produces slightly lower emissions than urea, while split nitrogen applications effectively reduce cumulative N₂O emissions by enhancing plant uptake and minimizing denitrification losses. Residue management contributes substantially and independently to total GHG emissions. Even distribution of residues results in approximately three times lower emissions compared to residue burning, demonstrating the critical role of residue handling as a mitigation strategy. Soil organic carbon levels also strongly affect CO₂ emissions, with carbon-rich soils exhibiting greater respiration and fluxes, especially under higher nitrogen inputs. Excluding SOC from emission calculations results in an underestimation of total CO₂ fluxes and a misrepresentation of treatment effects. A summary Table 5 consolidates key findings, demonstrating that the combination of split UAN nitrogen application, inclusion of soil organic carbon effects, and evenly distributed residues results in the lowest greenhouse gas emissions among all scenarios evaluated in the study. These findings highlight the importance of integrated, site-specific strategies that combine optimized nitrogen management, climate-smart residue handling, and explicit consideration of SOC dynamics to reduce the carbon footprint of corn production systems while sustaining or improving crop productivity.
Table 5. Greenhouse gas emissions based on the best management practices
|
Management Factor |
Condition |
Emission Value |
Total CO₂e (kg ha⁻¹) |
|
Nitrogen Application |
UAN – Split (2×50 kg N ha⁻¹) |
1.45 kg N₂O-N ha⁻¹ |
622 kg CO₂e ha⁻¹ |
|
Soil Respiration (CO₂ flux) |
SOC = 0.02 kg C/kg soil + UAN (split) |
0.87–1.7 Mg C ha⁻¹ |
3,193–6,239 kg CO₂e ha⁻¹ |
|
Residue Management |
Evenly distributed |
— |
111 kg CO₂e ha⁻¹ |
The DNDC model provided valuable insights into greenhouse gas emissions at Site A; however, its predictive accuracy was limited. The modest fit for nitrous oxide (N₂O) emissions (R² = 0.46) indicates that key environmental variables such as soil temperature, moisture, and water-filled pore space (WFPS) were not fully captured, highlighting the need to incorporate these factors in future model refinements to enhance simulation accuracy under varying field conditions. Additionally, the model’s indirect approach to estimating carbon dioxide (CO₂) fluxes through CO₂-equivalents introduces uncertainty, particularly regarding respiration-driven emissions, suggesting that future efforts should focus on directly simulating CO₂ fluxes to improve overall greenhouse gas accounting. The episodic nature of GHG fluxes, driven by events like rainfall and fertilization, underscores the importance of continuous, high-frequency field measurements for accurate model validation; therefore, expanding data collection using advanced monitoring technologies is essential to better represent temporal and spatial emission variability. Finally, exploring alternative nutrient management strategies, such as controlled-release fertilizers, nitrification inhibitors, and organic amendments like compost or manure, within the DNDC framework can provide effective pathways for mitigating emissions while promoting soil health and nutrient use efficiency, supporting more sustainable agricultural practices.
References
[1] F. Rovira-Más and V. Saiz-Rubio, "From smart farming towards agriculture 5.0: A review on crop data management," Computers and Electronics in Agriculture, vol. 169, p. 105223, 2020. View Article
[2] J. Wang, et al., "Nitrogen addition reduces soil respiration but increases the relative contribution of heterotrophic component in an alpine meadow," Functional Ecology, vol. 33, pp. 2239-2253, 2019. View Article
[3] B. Pramanick, M. Kumar, B. M. Naik, and M. Kumar, "Long-term conservation tillage and precision nutrient management in maize-wheat cropping system: Effect on soil properties, crop production, and economics," Agronomy, vol. 12, no. 11, p. 2766, 2022. View Article
[4] C. F. Drury, et al., "Stacking nitrogen management practices: Combining double-slot fertilizer injection with urease and nitrification inhibitors improves yields and reduces ammonia and nitrous oxide emissions," Soil Science Society of America Journal, vol. 88, no. 4, pp. 1309-1323, 2024. View Article
[5] E. Crenna, S. Belluco, and D. Donno, "Life Cycle Assessment of agricultural production systems: A comprehensive review," Sustainability, vol. 12, no. 7, p. 2835, 2020.
[6] I. Kesi, T. Nkosi, and T. Dube, "Life Cycle Assessment as a tool for sustainable agriculture: Current status and future perspectives," Sustainability, vol. 13, no. 4, p. 1880, 2021.
[7] J. Smith, K. Brown, and A. Lee, "Limitations of generic emission factors in agricultural LCA and prospects for improvement," Environmental Science & Technology, vol. 54, no. 3, pp. 1305-1315, 2020.
[8] Y. Liu, X. Chen, and J. Sun, "Revising emission factors in agricultural LCA for better regional accuracy," Journal of Environmental Management, vol. 309, p. 114675, 2022. View Article
[9] J. Garcia, R. Fernandez, and J. Martinez, "Improving emission factors in LCA for fertilizer management: Integration of agronomic data and field measurements," Journal of Cleaner Production, vol. 279, p. 123456, 2021.
[10] X. Zhao, Y. Wang, and Q. Liu, "Enhancing agricultural life cycle assessment with dynamic emission factors: Approaches and case studies," Journal of Cleaner Production, vol. 383, p. 135351, 2023.
[11] Q. Li, L. Zhao, and H. Liu, "Advances in modeling soil nitrogen transformations and emissions using process-based approaches," Science of the Total Environment, vol. 737, p. 139723, 2020.
[12] R. Kumar, P. Singh, and A. Mishra, "Modelling greenhouse gas emissions in agroecosystems using CENTURY and DayCent models: A review," Ecological Modelling, vol. 445, p. 109490, 2021.
[13] L. Chen, Y. Wang, and X. Li, "Advances in process-based modeling of nitrogen dynamics and greenhouse gas emissions in croplands," Environmental Modelling & Software, vol. 148, p. 105281, 2022.
[14] X. Wang, P. Liu, and F. Zhao, "Challenges in quantifying nitrous oxide emissions from corn cropping systems: A process-based modeling approach," Agricultural and Forest Meteorology, vol. 301, p. 108394, 2021.
[15] M. Abdalla, P. Smith, and M. Jones, "Evaluating nitrogen cycling and greenhouse gas emissions in agricultural soils using the DNDC model: recent advances and applications," Agricultural Systems, vol. 198, p. 103500, 2023.
[16] S. Patel, R. Mehta, and N. Sharma, "Integrating process-based models with life cycle assessment for improved environmental impact evaluation of fertilizer management," Environmental Impact Assessment Review, vol. 90, p. 106639, 2022.
[17] H. Zhang, Y. Gao, and W. Chen, "Trade-offs and synergies between nitrous oxide mitigation and crop yield: A meta-analysis," Agronomy for Sustainable Development, vol. 41, p. 52, 2021.
[18] F. Li, S. Wang, and J. Zhang, "Nitrous oxide emissions and crop yield responses to fertilizer management: A meta-analysis," Agricultural Systems, vol. 195, p. 103318, 2022.
[19] D. Gonzalez, F. Perez, and J. Torres, "Synergistic effects of combined fertilizer management practices on nitrous oxide emissions in crop systems," Agricultural Ecosystems & Environment, vol. 295, p. 106887, 2020.
[20] S. Jones and R. Smith, "Challenges in evaluating multiple simultaneous mitigation strategies in agricultural emissions studies," Environmental Research Letters, vol. 17, no. 3, p. 034003, 2022.
[21] D. Martin, G. Clark, and L. Thompson, "Nitrogen application methods and their influence on nitrous oxide emissions in corn production systems," Agronomy Journal, vol. 113, no. 5, pp. 4024-4034, 2021.
[22] W. Huang, Z. Li, and Y. Wu, "Limitations of field measurement methods for nitrous oxide emissions from croplands: A review," Agricultural and Forest Meteorology, vol. 301, p. 108346, 2021.
[23] Z. Asif and Z. Chen, "A Life Cycle Based Air Quality Modeling and Decision Support System (LCAQMS) for Sustainable Mining Management," Journal of Environmental Informatics, vol. 35, no. 2, p. 103, 2019.
[24] I. Shcherbak, N. Millar, and G. P. Robertson, "Global meta-analysis of the nonlinear response of soil nitrous oxide (N₂O) emissions to fertilizer nitrogen," Proceedings of the National Academy of Sciences, vol. 111, no. 25, pp. 9199-9204, 2014. View Article
[25] J. Niu, et al., "N-Use Efficiency and Yield of Cotton (G. hirsutum L.) Are Improved through the Combination of N-Fertilizer Reduction and N-Efficient Cultivar," Agronomy, vol. 11, no. 1, p. 55, 2020. View Article
[26] R. T. Venterea, B. Maharjan, and M. S. Dolan, "Fertilizer Source and Tillage Effects on Yield-Scaled Nitrous Oxide Emissions in a Corn Cropping System," Journal of Environmental Quality, vol. 40, no. 5, pp. 1521-1531, 2011. View Article
[27] Y. Yu, C. Zhao, and H. Jia, "Ability of split urea applications to reduce nitrous oxide emissions: A laboratory incubation experiment," Applied Soil Ecology, vol. 100, pp. 75-80, 2016. View Article
[28] M. Tariq, et al., "Impact of elevated CO₂ on soil microbiota: A meta-analytical review of carbon and nitrogen metabolism," Science of the Total Environment, vol. 950, p. 175354, 2024. View Article