International Journal of Environmental Pollution and Remediation (IJEPR)
ISSN: 1929-2732

Volume 1 - Year 2012 - Pages 13-19
DOI: 10.11159/ijepr.2012.003
Drinking Water Source Contamination Early Warning System and Modelling in China: A Review
Alejandra Burchard-Levine¹, Shuming Liu², Francois Vince³
¹ Tsinghua-Veolia Joint Research Center
School of Environment, Tsinghua University, Beijing, 100084, China
burchard-levin10@mails.tsinghua.edu.cn
² School of Environment, Tsinghua University
Beijing, 100084, China
shumingliu@tsinghua.edu.cn
³Veolia Environment
8 North Dongsanhuan Road, Beijing, 100004, China
francois.vince@veolia.com
Abstract - China's fast pace industrialization and growing population has led to several accidental surface water pollution events in the last decades. This has severely affected the safety of large populations downstream whom are dependent of these waters for drinking. In other countries such as the USA, several accidental pollution events have forced these to develop early warning systems (EWSs) for the protection of their drinking water sources. The government of China, in its 11th Five Year plan, after the 2005 Songhua River incident, has pushed for similar actions. Despite recent government efforts, there are still many weaknesses and gaps in EWS in China such as the lack of pollution monitoring and advanced mathematical models to predict and forecast pollution events. The application of existing physical models for water quality prediction in China can be challenging due to information availability issues. Data Driven Models (DDMs) such as Artificial Neural Networks (ANNs) have acquired recent attention as an alternative to physical models which require large amounts of data, do not take into account nonlinear hydrological properties, are computationally demanding and not always flexible.
Keywords: Early Warning System, Drinking Water Source, Artificial Neural Networks, China
© Copyright 2012 Authors - This is an Open Access article published under the Creative Commons Attribution License terms. Unrestricted use, distribution, and reproduction in any medium are permitted, provided the original work is properly cited.
1. Introduction
China's fast pace industrialization and growing population has led to several accidental pollution events. In particular, surface water pollution accidents have raised significant concern in China. It is even said that 38% of aquatic pollution events in China from 1985 to 2005 came from traffic accidents (Zhang, et al., 2011). This is of great concern for populations living downstream and using contaminated surface water as drinking sources. This has led the Chinese government to take severe actions for the implementation of prevention and control measures. Implementing EWSs for the protection of drinking water source has been a key priority in the last decade. Nonetheless, severe water pollution disasters, especially accidental spills, have still happened in the past years such as:
- The blast of Jihua petroleum factory upstream of the Songhua River in Jilin Province, in November 2005. The blast caused a leak of toxic materials into the Songhua River which is the sole source of drinkable water of several major cities in Northeast China and forced local governments to exercise a regional emergency plan (Hu, 2009).
- The cadmium spill which contaminated over 100 km of the Longjiang River in southwestern China's Guangxi region, in January 2012. The spill prompted residents of the river's downstream Liuzhou, a city of 3.2 million to stock up on bottled water. The area upstream of the Longjiang River has seen repeated spills from smelters and miners operating in this area and has been repeatedly singled out for inadequate controls on heavy metal pollution (Web-1, 2012).
There still appears to be a need for water utilities in China to develop and implement advanced EWS. This would allow water utilities to act accordingly and protect its intake in cases of emergency, thus ensuring continuous and safe drinking water supply to the population. The following article explains all the components required for a thorough advanced EWS, explores the achievements in the international community, and reviews the state of EWSs in China. Finally, the use of water contamination prediction and forecasting models are introduced as an important component to EWSs.
2. Early Warning System Components
Public drinking water supplies using surface source waters such as rivers are vulnerable to a variety of disruptions in water quality as a result of accidental, intentional, or natural contamination of supplies. Protecting the water source is the first step needed to ensure a drinking water plant does the necessary treatment steps and supplies safe potable water to its downstream population. Most drinking water Treatment plants do practice forms of monitoring their source water. However, the data transmitted by monitors are often limited in the number of parameters measured, and are collected at a frequency that is not conducive to detecting sudden changes in water quality (e.g., weekly, monthly, or quarterly sampling) (Grayman, 2001). In order to overcome these limitations, source water EWSs are designed to improve on the information available and to utilize these and other information in an integrated approach for identifying and responding to contamination before it enters the drinking water supply (Grayman, 2001). EWSs will therefore help to give more information and time to the plant operators on how to deal with a possible contamination event, reduce additional treatment costs related to pollution control and ultimately improve drinking water safety and continuous supply to the population.
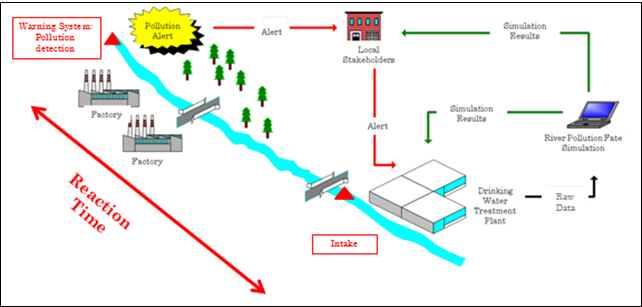
When referring to an EWS, very often, only the monitoring systems for pollution detection are taken into account. In reality, an EWS includes a wide range of components that work together to prevent contaminants from entering a water supply. These components displayed in Fig. 1 include the following (Grayman, 2001):
- A mechanism for detecting the likely presence of a contaminant in the source water.
- A means of confirming the presence of the contamination, determining the nature of the contamination event and predicting when (i.e. reaction time) the contamination will affect the source water at the intake sites and the intensity (concentration) at the intake.
- An institutional framework generally composed of a centralized unit that coordinates the efforts associated with managing the contamination event.
- Communication linkages for transferring information related to the contaminatio
- Various mechanisms for responding to the presence of contamination in the source water in order to mitigate its impact on water users.
For the purpose of this paper, a focus on an EWS's detection, confirmation and characterization of contamination components will be done.
2.1. Detection Mechanisms
The first step of an EWS is to detect the possible presence of a contaminant in surface water being used as drinking water source. The primary objective of the detection phase is to raise a warning, in a very timely manner, that the source water has been contaminated (Grayman, 2001).
There are three general accidental pollutant event detection mechanisms (Grayman, 2001):
- Monitoring. Conventional physico-chemical monitoring instruments are used to measure specific compounds or values as indicator parameters. Other type of instruments are biomonitors which measure the stresses placed on living organisms by contaminants or other changes in the environment.
- Public Reporting. This mechanism is most effective with large contamination events such as ones resulting in fishkills, involving contaminants that are readily detectable by sight or odor, and events in more heavily populated areas. In most cases, such reports are made to the police or fire emergency phone numbers by the public.
- Self-Reporting. The most effective mechanism for identifying the presence of a contaminant should be self-reporting by the discharger of the contaminant. If the discharger is aware of the contamination event then this method can result in a report that is the most timely and exact in terms of location, type, and extent of the contaminant. In most developed countries, laws require self-reporting of any significant spill. However, the compliance with such laws varies significantly around the world. In many cases in China, dischargers will not report spills in order to avoid fines if they feel they can get away with it.
In China, public reporting and especially self-reporting are to date still challenging. Hence, monitoring stations play a bigger role as the main detection mechanism.
2.2. Confirmation and Characterization of Contamination Mechanisms
Following the detection of a contamination event, the next step in the EWS process is confirmation of the event. In addition, development of further data on the event is needed for an effective response. Confirmation involves additional sampling and testing to make sure that the initial detection was indeed correct. Incorrect detection leads to false positives associated with monitoring instrumentation or incorrect public reports. Some advanced monitoring stations automatically take samples at fixed intervals and store these samples for a fixed period (e.g., 24 h). Other stations are designed to take samples automatically when a monitor detects an unusual event. In either case, the samples can then be analyzed using standard tests to confirm and characterize the nature of the contaminant involving the following actions (Grayman, 2001):
- Determine the specific contaminant(s) involved.
- Determine the spatial and temporal variation in concentration in the source water.
- Identify the likely source of the contaminant (if unknown).
- Assess the dynamic behaviour of the contaminant in the water body (mixing and decay behaviour).
- Redict the movement of the contaminant within the water body so that the time that the leading and trailing edges of the contaminant plume reach water intakes and also the likely concentration at the intake can be predicted.
- Determine impacts on the waterway itself (e.g., fish kills).
Characterization of the contaminant is generally accomplished through collection of samples either in the field, laboratory monitoring or in-stream tracking of the event. For more advanced characterization mathematical models can be used to assess and predict the movement of a spill in a water body (Grayman, 2001). This would allow for the drinking water treatment plant's operators to know how much time they can have to react before the contaminant reaches the intake and when an emergency shutdown would have to take place. This paper is concerned of mathematical models used to support EWSs by predicting and forecasting the movement of accidental contaminations.
3. International Experience
Most International EWSs have been developed after responding to serious accidental pollution events such as the 1986 Sandoz spill on the Rhine River, the 1976 carbon tetrachloride spill on the Ohio River, the 1984 phenol spill on the River Dee, The oil spills of Torrey Canyon in UK (1967), and Exxon Valdez in Alaska, USA (1989) (Zou & Li, 2009). However, advanced EWSs are defined as those employing state-of-the art monitoring equipment, modelling and communications as an integrated system providing warning of contaminants in the source water. Based on this definition, there are only a relatively few advanced EWSs around the world (Grayman, 2001). A few of these advanced EWSs are mentioned.
In the USA, the Ohio River Valley Water Sanitation System (ORSANCO) detects spills and contaminants by an organic detection system. This EWS performs mathematical modelling of the movement of the spill in the river, collecting field data, and disseminating information to downstream water utilities (Grayman, 2001) . In the UK, the River Dee is a major water source for northern wales and England. Its EWS is composed of on-line water quality monitoring stations and gaugin stations. The stations operate unattended (except for routine maintenance several times per week) and information is provided through telephone lines (Grayman, 2001). In Paris, France, more than 95 percent of the raw water originates from surface water sources, the Seine River. After several accidents, an EWS has been installed composed of a series of monitoring stations composed of monitors, automatic samplers, forecast mathematical models, and inventories of toxic chemicals stored upstream of their intakes (Grayman, 2001). In Japan, the Yodo River EWS notifies immediately water utilities when a contaminant is found. Oil spills form the majority of the reported contaminant events though others include pesticides, phenol and a wide range of chemicals. Monitoring facilities include several unique biomonitoring stations, advanced TOC and UV monitors, gas chromatographs, standard water quality monitors, and odor detector units used by treatment plant operators (Grayman, 2001).
International advanced EWSs, have not only invested in state-of-art monitoring detection technologies, but have implemented forecasting mathematical models to characterize and confirm the behaviour of possible accidental events. These methods allow water utilities to be prepared and take efficient preventative actions.
4. State of Early Warning Systems in China
Along with China's rapid industrialization and increase in population, the country is at a stage of frequent pollution accidents. Traditionally, Chinese practice in water emergency management has been mainly focusing on mitigation after an incident. In fact prevention before an incident is more important than mitigation after an incident. China's EWSs for sudden water pollution accidents began to be explored only after the Songhua River toxic spill in 2005. The Government of China took some immediate steps to strengthen national environmental emergency prevention and response for water pollution incidents (Zou & Li, 2009). For that reason, in 2006, the 11th Five Year plan initiated a great emphasis on environmental protection through pollution control and prevention. Presently, at the beginning of the 12th Five Year plan, the Chinese government is still prioritizing the construction of water conservation and disaster prevention and mitigation system by strengthening forecasting, prevention and emergency response to extreme weather, earthquakes and natural disasters (PRC, 2011).
For instance, the Chinese Government has proposed numerous protocols and measuring systems for aquatic environment management. In the seven major river basins, more than 100 monitoring stations have been built (Web-2). However, the research data and measuring equipment are still insufficient in detecting unexpected accidental pollution events (Zhang, et al., 2011). It is indeed difficult to confirm abrupt accidents, since no system in these stations is capable of alarming the sudden change of water quality, especially in the case of combined pollution. Some EWSs for source water quality have been established in China such as Raw Water EWS of Tianjin Water Supply Co. and water quality warning and forecasting system in Wuhan Section of Han River. Compared to foreign practice, construction on communication system of China's EWS is as advanced as the outside. For example Tianjin Water Supply Co. implemented GPRS communication system. But there is no EWS directly for accidental water pollution incidents because of no appropriate monitoring system available (Zou & Li, 2009). Despite recent government efforts, there are still many weaknesses and gaps in EWS in China (Zou & Li, 2009).
In recent years, the Chinese Government has promoted international cooperation in the areas of pollution prevention and control. In the area of drinking water source protection, a recent large cooperation project has been implemented, the EU-China River basin Management Programme. A study on the Yellow River Basin was done in order to test integrated water resources protection practices and systems for prevention, reduction and control of water pollution (Web-3). The EU China River Basin Management Program carried out the Development of Early Warning Emergency Response (EWER) forecasting system for pollution incidents in the middle reaches of the Yellow River Basin. In order to be able to conduct the efficient study a group of experts including both international and domestic experts to participate in the project. This project supports tools to manage wastewater discharges to the river and strengthen the EWS for pollution incidents. The tools used, namely a physical model, MIKE 11 by DHI can be used to assess the environmental carrying capacity of the river by simulation of the impact of pollution loads from urban and industrial wastewater discharges (Sene & Darch). The model may also be used to predict the time and downstream concentrations of pollutants, which are discharged to the river by accident, and thereby make it possible to warn downstream users (Web-3).
5. Focus on Modelling in Early Warning Systems
Mathematical models are used after pollution detection, in order to characterize the pollution and especially to understand the contamination event movement in the river. One major objective of these models is to determine with sufficient accuracy the transfer time needed for pollution to move from its current location and reach the raw water intake. One second objective may be to characterize the pollution plume when it reaches the raw water intake in order to determine whether or not the intake should be closed and if yes, how long the raw water intake should be closed until the plume has passed the intake.
Surface water modeling, a.k.a hydrological modelling, encompasses a wide range of methods that can be used to predict the hydraulics and water quality in an aquatic environment (Grayman, 2001). For more than 100 years, hydrological equations solving hydraulics and water quality predictions have been used. Since the 1950s, computerized methods have been developed and taken hydrological simulations to another step (Rosbjerg & Madsen, 2005). In the context of EWSs, the specific type of modeling of interest involves the modeling of transient water quality conditions associated with spills or other contamination events and their potential impact on drinking water intakes. This class of models is frequently referred to as "spill models" (Grayman, 2001). Throughout the literature, many hydrological models, whether a public tool or licensed tool, can be used to model accidental spills and characterize its behaviour. There are many ways of classifying these hydrological models. In this paper, we choose to divide them into two categories:
- Physically-based "white-box" models that calculate and integrate all the physico-chemical mechanisms occurring in the river (e.g. sedimentation) to predict pollutant fate (Hao, 2006).
- Empirically-based or data driven "black-box" models that aim at predicting pollutant fate using a purely numeric (e.g. statistical methods such as regression) approach and without any detailed understanding of physico-chemical mechanisms.
5.1. Physically-based Models
Physically-based models build upon physical "determinist" laws (e.g. hydrodynamics, sedimentation coefficient…) to describe the river flow and pollutants fate. These models allow users to characterize and confirm possible accidental pollutant events by predicting the pollutants behaviour and time of travel in the river. In this way, one can precisely predict how a pollutant in a river will move from any point, i.e. model the pollutant's fate.
There are three basic components of these models:
- A flow module, describing the movement of the water
- A water quality transport module, describing the processes by which the contaminant concentration changes due to the hydrodynamic forces
- A fate module describing the impacts of physical, chemical, and biological processes on the form and concentration of the contaminant.
MIKE 11 by DHI
The MIKE 11 is a popular physically based River modelling system. It is a one-dimensional (1D) model for rivers, canals, floodplains, reservoirs and structures. Some areas of application include urban networks, water quality modelling, sediment transport and real time flood forecasting. It can be used for simple 1D river modelling (Landrein, 2011). The MIKE 11 contains different modules such as the rainfall-runoff (NAM) module, Hydrodynamic module (HD) and advection-dispersion (AD) module.
Overall, MIKE 11 model provides accurate hydraulic description in rivers/channels which are one-dimensional flows. It is rapid and has less computational points relative to 2D model, while being easy to analyze and extract results (Landrein, 2011).This model is suitable when detailed flow patterns and depths are not important, when there are many complex structures and where short simulation time is important (i.e. real time forecasting river basin models) (Landrein, 2011).
5.2. Data Driven Models
Data Driven models (DDMs) rely on equations derived experimentally using available data and are usually site specific (Wai, 2007). The main part of data-driven modelling is, in fact, learning which incorporates the so-far unknown mappings (or dependencies) between a system's inputs and its outputs from the available data. By data we understand the known samples that are combinations of inputs and corresponding outputs. As such, a dependence ("model") is discovered (induced), which can be used to predict the future system's outputs from the known input values (Solomatine & Ostfeld , 2008).The most frequent types of DDMs used have been statistical, fuzzy logic and Artificial Neural Networks (ANNs). ANNs have acquires recent attention for being flexible and overcoming difficulties associated to the aforementioned physical models.
The advantages of data-driven models over the physically based models are that they are less data and computationally demanding, therefore feasible to use for real-time forecasting. Furthermore, such data-driven models are of particular importance to developing countries with limited hydro-meteorological data (Pang et al., 2007). This is a very important fact for the Chinese situation, where is difficult to obtain data and often no data is even available due to lack of monitoring.
Artificial Neural Networks (ANN)
For many years, practitioners in water resources have primarily used simple linear regression or time series models to obtain approximations of the relationships between variables. One reason for this is that the rules governing sophisticated nonlinear statistical models have generally been considered to be too restrictive and make it too difficult to utilise them for real-life applications (Maier & Dandy, 2000). For this reason, practitioners in water resources have had the tendency to move away from traditional statistical approaches and have explored other DDM methods such as Fuzzy rule-rule base systems (FRBS) and Artificial Neural Networks (ANNS).
Fuzzy and ANN modelling methods are similar where both of them create a quantitative inner chain of links between input and output quantities without explaining/justifying the physical reason of those links. They mimic, in fact, the intuitive human way of relating causes with their effects (Alvisi, Mascellani, Franchini, & Bardossy, 2006). It has been shown that the models based on the fuzzy logic approaches may fail unexpectedly in forecasting, in the sense that, some input combinations are not recognised by the rule system and thus no forecasting is performed. This problem does not occur in the ANN approach (Alvisi, Mascellani, Franchini, & Bardossy, 2006).
Over the last 15 years or so, the use of ANNs for water quantity and quality characterization has become a well-established research area where their computing abilities have been proven in the fields of prediction and estimation, pattern recognition, and optimization (Adeli, 2001) (Maier et al., 2010). They are powerful pattern recognizers and classifiers. They operate adaptive tools that learn significant structures in data and allow mimicking those patterns, in order to forecast data without the need to formalize how these patterns work and what inner mechanisms/formula are involved.
Numerous applications of predictive ANN models to water resources modelling and time-series analysis have been reported for forecasting of water quality and quantity parameters (May et al., 2009). ANN models are developed using available data and are not based on underlying physical processes explicitly (Maie et al., 2010). This is particularly convenient for cases of modelling rivers or river basins where complex and multiple phenomena are involved. In many cases the best available physical model does not fully describe a system, owing to some unknown process, which results in a structures error in model estimates (May et al. 2009). For examples, the existing nonlinear hydrological relationships, which are so important when building flow forecasting models for river basin management, are effectively captured by ANNs.
6. Conclusion
An advanced EWS must include detection, characterization and confirmation components. In order to achieve this, monitoring and modelling are needed. In China, after the 2005 Songhua River accident, there was a lot of emphasis put by the government to develop EWS. However, there is a lack of advanced EWS directly used for accidental water pollution incidents because of inappropriate monitoring systems. Without appropriate monitoring systems, modelling becomes a challenge.
Water quality prediction models can be generally classified into physical models and Data-Driven models. Physical models for water contamination prediction and forecasting are very popular and useful when all the information needed is available. In the case of China where data availability is a big problem, Data-Driven models, such as ANNs, can overcome this issue with its flexibility which allows it to predict and forecast with limited available data.
Meanwhile, China is still facing pollution accidents which put at stake populations downstream. There still is a need for water utilities in China to implement advanced EWS, in order to act accordingly and protect its intake in cases of emergency, thus ensuring continuous and safe drinking water supply to the population.
Acknowledgements
This work was supported by the Tsinghua University-Veolia Environment Joint Research Center for Advanced Environmental Technology.
References
Adeli, H. (2001). Neural Networks in Civil Engineering: 1989−2000. Computer-Aided Civil and Infrastructure Engineering, 16 126–142. View Article
Alvisi, S., Mascellani, G., Franchini, M., & Bardossy, A. (2006). Water level forecasting through fuzzy logic and artificial neural network approaches. View Article
Hao, F. e. (2006). The significance, difficulty and key technologies of large scale model applied in estimation of non-point source pollution. Acta Scientiae, 362-365 (in Chinese). View Article
Hu, B. e. (2009). Safe river water: A ubiquitous and collaborative water quality monitoring solution. Pervasive and Mobile Computing 5, 419-431. View Article
Landrein, J. (2011). MIKE by GHI. HYDROEUROPE.
Maier, H. R., & Dandy, G. C. (2000). Neural networks for the prediction and forecasting of water resources variables: a review of modelling issues and applications. 15, 101-124. View Article
Maier, H. R., Jain, A., Dandy, G. C., & Sudheer, K. P. (2010). Methods used for the development of neural networks for the prediction of water resource variables in river systems: Current status and future directions. Environmental Modelling & Software , 25 891-909. View Article
Pang, B., Guo, S., Xiong, L., & Li, C. (2007). A nonlinear perturbation model based on artificial neural network. (333 504-516). View Article
PRC, N. P. (2011). 12th Five-Year Plan of the People's Republic of China (extracts in English). Beijing: EU-China Civil Society Forum. View Article
Landrein, J. (2011). MIKE by GHI. HYDROEUROPE.
Rosbjerg, D., & Madsen, H. (2005). 10: Concepts of Hydrologic Modeling. In M. G. Anderson, Encyclopedia of Hydrological Sciences. John Wiley & Sons, Ltd. View Article
Sene, K., & Darch, G. Risk and uncertainty in hydrological forecasting. (118). View Article
Solomatine, D. P., & Ostfeld , A. (2008). Data-driven modelling: some past experiences and new approaches. Journal of Hydroinformatics, 10.1. View Article
Wai, T. (2007). Integrated River Management of the East River -Field Studies, Hydrologic and Water Quality Modelling. The University of Hong Kong.
Zhang, G., Chen, L., Liu, Y., Chon, T., Ren, Z., Wang, Z., et al. (2011). A new online monitoring and management system for accidental pollution events developed for the regional water basin in Ningbo, China. Water Science & Technology, 1828-1834. View Article
Zhang, G., Patuwo, E., & Hu, Y. M. (1998). Forecasting with artificial neural networks: The State of the art. 14, 35-62. View Article
Zou, J.-L., & Li, J.-Y. (2009). Establishment of Early Warning System for Accidental Water Pollution Incidents in China. International Conference on Environmental Science and Information Application Technology. View Article
Website References
Cadmium spill threatens water supply in Liuzhou, China, CTV News, Consulted 14 February 2012. View Website
Automatic Water Quality Monitoring Stations, Consulted 01 January 2012. View Website
EU-China Rivers, Consulted 19 October 2011. View Website