International Journal of Environmental Pollution and Remediation (IJEPR)
ISSN: 1929-2732

Volume 13 - Year 2025 - Pages 58-68
DOI: 10.11159/ijepr.2025.007
Spatiotemporal Variations in Water Quality of the Lower Godavari Basin and Their Agricultural and Health Implications
Pratyusha Tatavarthi1, Prabhakar Singh2, Vignesh Gandu1, Dewanshi Dahake3, Adarsh Reddy Vangala2, Keerthi Katam1
1Mahindra University, École Centrale School of Engineering, Department of Civil Engineering
Telangana, India 500043
Prathyusha22pcie001@mahindrauniversity.edu.in; se21ucie017@mahindrauniversity.edu.in; se21ucie001@mahindrauniversity.edu.in; Keerthi.katam@mahindrauniversity.edu.in
2Nagaland University, Department of Agricultural Engineering
Dimapur, Nagaland, India 797112
cougar.singh@gmail.com
3Indian Institute of Science Education and Research, Department of Biology
Bhopal, India 462006
dewanshidahake@gmail.com
Abstract- Seasonal variations in water quality play a vital role in assessing the ecological and environmental behaviour of river systems, explicitly in agriculture-dominant regions like the Godavari River basin in Andhra Pradesh, India. The study focuses on evaluating spatiotemporal variations for key physicochemical parameters like pH, salinity, dissolved oxygen (DO), alkalinity, hardness, total solids (TS), chlorides, and optical density at 254 nm (OD254) during the three distinct hydrological seasons- pre-monsoon, monsoon, and post-monsoon. Water samples were collected from strategically selected eight sites (named S1 to S8) along the river from Polavaram to Dowleswaram and were tested following standard laboratory procedures. The findings showed notable seasonal variations driven by anthropogenic activities, agricultural runoff, and monsoonal rainfall. While the greater amounts of chlorides during the pre-monsoon suggest pollutant deposition under low-flow circumstances, increased total solids during the monsoon were caused by surface runoff. Moderate levels of the majority of indicators in post-monsoon waters displayed the role of sedimentation and dilution. Site S2 was always recognized as an outlier based on Principal Component Analysis (PCA) and Hierarchical Cluster Analysis (HCA), reflecting perennial pollution mostly due to organic content throughout the year. The results highlight the need to conduct ongoing seasonal monitoring to understand the changes in water quality, which can guide regional water management plans. The research highlights the need to practice integrated watershed management techniques in areas experiencing significant agricultural and industrial expansion to protect rivers.
Keywords: HCA, PCA, pre-monsoon, monsoon, post-monsoon, Water quality
© Copyright 2025 Authors - This is an Open Access article published under the Creative Commons Attribution License terms. Unrestricted use, distribution, and reproduction in any medium are permitted, provided the original work is properly cited.
Date Received: 2025-04-10
Date Revised: 2025-09-29
Date Accepted: 2025-10-11
Date Published: 2025-10-17
1. Introduction
River water is the fundamental source of water for agriculture, industrial activities, and domestic use. It plays a vital role in supporting life and sustaining the ecosystem. The dynamic nature of the river makes it an essential source of surface water, especially in agriculture-dependent countries like India [1]. Nevertheless, due to expansion in the industrial sector, agricultural advances, and urbanization, the quality of river water has been significantly altered. In addition to safeguarding human health, water quality monitoring is crucial for preserving ecological stability and promoting sustainable development. Because of its vast drainage basin, reliance on agriculture, and socioeconomic significance, the Godavari River is extremely important in southern India [2].
The Godavari River is essential to Andhra Pradesh's economy, aquaculture, agriculture, and potable water supply, especially in the East and West Godavari areas [3]. The increase in the population has increased the demand for water resources. This has led to a depletion of the quality of water resources. Increased use of fertilizers, pesticides, domestic sewage discharge, and effluents from both major and small-scale enterprises has led to a decline in water quality in many sections of the river [4]. During the non-monsoon and monsoon seasons, seasonal fluctuations caused by runoff, dilution, and increased sediment transit have a major impact on the physical and chemical features of river water [5]. Water quality is generally evaluated by studying the physical, chemical, and biological parameters [6], [7]. Dissolved oxygen (DO), pH, and total solids (TS) are the significant parameters for understanding water quality [8]. For instance, total dissolved solids (TDS) give information on the mineral content and salinity. Similarly, pH shows how acidic or basic the water is. DO is an indication of the level of organic pollution and the presence of both biodegradable and non-biodegradable contaminants.
During the pre-monsoon season, because of the slower river flow and lower water levels, there is a greater concentration of pollutants due to the limited ability for dilution [9]. On the other hand, Dilution of existing pollutants is a result of higher rainfall and runoff during the monsoon season, combined with land use patterns and watershed management techniques. The post-monsoon season is a crucial transitional time when sedimentation takes place and water bodies start to recover from monsoonal effects, making it important to study the water quality post-rains [10]. Therefore, it is necessary to study the seasonal variations of water quality to understand the state of the river system and potential dangers to the ecosystem.
Previous studies in the Godavari River were focused mainly on seasonal trends in the overall water quality [4], [11]. The current study aims at a detailed concurrent application of HCA and PCA analysis to understand the most influential physicochemical parameters affecting the water quality. Within a portion of the Godavari River basin, this study examines the geographical and temporal variation in important physicochemical water quality indicators. The study is carried out during three different hydrological seasons: pre-monsoon, monsoon, and post-monsoon. Samples taken throughout each season were subjected to laboratory testing, and data were gathered from several sampling sites. This approach helps in identifying potential hotspots, simultaneously highlighting the season-specific changes and their impact on water quality. The study provides an in-depth analysis that can guide water resource management in an area that is heavily reliant on surface water for a variety of purposes. This study intends to support continued efforts in river basin monitoring, sustainable water use, and pollution control.
2. Study Area
The east and west Godavari regions are mostly agricultural areas that rely largely on surface water from the Godavari River (Figure 1) and its network of canals for irrigation, paddy fields, aquaculture ponds, and banana plantations, all of which are water-intensive [12]. Seasonal rainfall from the southwest monsoon has a considerable impact on river discharge, dilution, and the movement of numerous biochemical elements in the water. The sampling sites chosen run along the district's river and canal systems, and include areas with various land use patterns such as agricultural zones, rural communities, and semi-urban discharge points. These locations were chosen to reflect the impact of both point and non-point sources of pollution. Anthropogenic activities, return flows from paddy fields, aquaculture effluents, and household sewage outflows all have a substantial impact on water quality. The climate in the research region is tropical, with high humidity and mean annual temperatures ranging from 24°C to 38°C. The monsoon season normally lasts from June to September, with a comparatively dry post-monsoon period from October to December, and a pre-monsoon season from March to May. These climatic fluctuations have a substantial impact on surface water availability, dilution potential, and microbiological and chemical activities in the aquatic system.
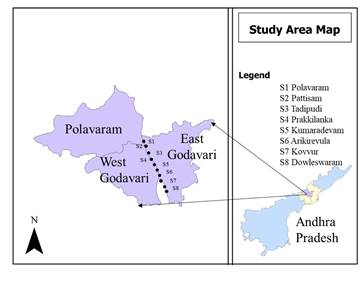
Figure 1 represents the map showing the location of the sampling points and the outline of the study area. The sampling sites are located in the lower portions of the Godavari Basin, where the river slows and deposits sediment, resulting in extended residence time for toxins and higher interaction between water and sediment [13]. Lower velocities during the post-monsoon and pre-monsoon periods may also increase eutrophication and biological activity [14], [15]. The geographic coordinates of the sites are summarised in Table 1.
Table 1. Geographic coordinates of the sites.
|
Site Number |
Location Name |
Latitude |
Longitude |
|
S1 |
Polavaram |
17.24 |
81.646 |
|
S2 |
Pattisam |
17.21 |
81.640 |
|
S3 |
Tadipudi |
17.16 |
81.661 |
|
S4 |
Prakkilanka |
17.13 |
81.667 |
|
S5 |
Kumaradevam |
17.06 |
81.71 |
|
S6 |
Arikirevula |
17.05 |
81.72 |
|
S7 |
Kovvur |
17.01 |
81.740 |
|
S8 |
Dowleswaram |
16.93 |
81.78 |
3. Methodology
3.1 Collection of water samples
The study was carried out in Andhra Pradesh's Godavari River basin, which is mostly an agricultural area with significant irrigation, household, and industrial uses for the river water. Based on observed pollution levels, closeness to agricultural areas, and human populations, eight sampling sites were carefully chosen throughout the river route. Sampling was done during three seasons: Pre-Monsoon (July 2024). This period represents a dry-season scenario with limited flow and elevated solute concentrations. Monsoon (September 2024) illustrates the time of greatest precipitation and its effects on erosion, runoff, and suspended particles. Post-Monsoon (December 2024) shows that water quality has stabilized following rainfall, with dilution and sedimentation impacts becoming less significant. Water samples were collected according to standard procedures. To prevent surface contamination, samples were taken 20–30 cm below the surface with the help of clean, sterilized plastic bottles. Within 24 hours after being collected, all samples were brought to the lab for examination and kept at 4°C.
3.2 Water quality analysis
Parameters such as pH, salinity, and DO were measured on site using a handheld water quality meter (Make: TOA DK; Model: WQC-30), and the laboratory analysis for hardness, alkalinity, TS, and chlorides was carried out following standard methods for water and wastewater [16]. The accuracy of the data was ensured by doing each analysis in triplicate. Before use, all instruments and glassware were calibrated, and blanks and common reference materials were used to maintain quality control.
3.3 Statistical analysis
Principal component analysis (PCA) was carried out to understand the influential parameters and the correlation between them. PCA is an orthogonal linear transformation that transforms the variables to a new coordinate system. In the new coordinate system, the highest variance projected by any variable falls in the first coordinate, the second-highest variance falls in the second coordinate, and so on [17]. The principal component gives information on the most influential parameters, which gives details of the overall data set, allowing data reduction while reducing the loss of original information [18]. Hierarchical Cluster Analysis (HCA) was further carried out to support the findings from PCA. The statistical analysis was performed using Origin Pro software.
4. Results and Discussions
4.1 Water quality parameters - Seasonal variation
The pH levels in the pre-monsoon, monsoon, and post-monsoon seasons are presented in Table 2. The values of pH lie between 6.87 and 8.20 in all seasons, which is within the permissible range for freshwater systems. Pre-monsoon pH readings were usually higher (mean ≈ 7.95), peaking at S4 (8.20), suggesting alkaline conditions that may have been caused by decreased bicarbonate ion movement, evaporation, and concentration. On the other hand, post-monsoon pH fell to its lowest point at S4 (6.87), most likely as a result of increased microbial activity that contributed to organic acids and dilution from rainfall and runoff. Although somewhat lower than the pre-monsoon, the monsoon season's pH readings (7.54–8.06) remained alkaline, indicating that enhanced runoff has a moderating influence on pH levels. These findings were similar to previous literature [19]. The seasonal pattern indicates that the acid-base state of the river system is influenced by hydrological dilution and biogeochemical activities [20]. All samples and seasons showed a constant low salinity of 0.01%, indicating that the Godavari River is a freshwater [21]. The changes in the salinity suggest that saltwater intrusion is frequently observed in rivers that are impacted by tides or as a result of groundwater pumping. Neither of these is a significant issue in the areas that were examined [22]. It also shows that there were no notable industrial saline discharges during the research period.
Table 2. pH values corresponding to Pre Monsoon, Monsoon, and Post Monsoon seasons.
|
Site |
Pre Monsoon |
Monsoon |
Post Monsoon |
|
S1 |
8 |
8 |
7.2 |
|
S2 |
7.8 |
7.9 |
7.1 |
|
S3 |
7.9 |
7.9 |
7 |
|
S4 |
8.2 |
7.8 |
6.8 |
|
S5 |
7.9 |
7.6 |
6.9 |
|
S6 |
7.9 |
7.5 |
7.1 |
|
S7 |
7.8 |
7.7 |
7 |
|
S8 |
8 |
7.7 |
7.1 |
One important measure of the health of aquatic ecosystems is dissolved oxygen. There were noticeable seasonal fluctuations in DO concentrations presented in Table 3. The pre-monsoon period had the lowest DO levels (2.00–2.97 mg/L), and some locations (such as S6 and S8) were getting close to hypoxic conditions, which can result in dead zones for the ecosystem [23]. These might be caused by organic pollution, thermal stratification, and decreased re-aeration as a result of low flow. Monsoon values increased to 6.30 mg/L at S3, indicating a considerable improvement. High DO levels were caused by increased aeration, turbulent flow, and organic matter dilution after intense rains [24]. Following the monsoon, DO decreased somewhat (3.3–4.2 mg/L), most likely as a result of less turbulence in water bodies and the breakdown of stored organic waste. The temporal trends highlight the river system's susceptibility to oxygen depletion, particularly during dry spells, which can have a negative impact on aquatic life. Low DO levels are a sign of potential organic pollution that increases harmful microbial growth, posing a potential health risk to communities relying on water for consumption [25].
Table 3. DO values corresponding to the Pre Monsoon, Monsoon, and Post Monsoon seasons.
|
Site |
Pre Monsoon |
Monsoon |
Post Monsoon |
|
S1 |
2.9 |
5.1 |
3.7 |
|
S2 |
2.4 |
5.6 |
4.2 |
|
S3 |
2.3 |
6.3 |
4 |
|
S4 |
2.6 |
4.4 |
3.9 |
|
S5 |
2.1 |
4.9 |
363 |
|
S6 |
2 |
4.9 |
3.3 |
|
S7 |
2.3 |
4.9 |
3.6 |
|
S8 |
2.1 |
4.8 |
3.9 |
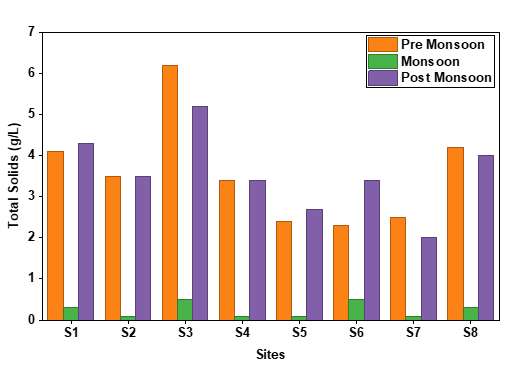
Seasonal variations were significant in total solids, which include both suspended and dissolved materials. The levels of total solids during the non-monsoon and monsoon seasons are given in Figure 2. During the pre-monsoon, low dilution capacity, evaporative concentration, and agricultural runoff are the reasons for the highest concentrations (up to 6.24 g/L at S3). In the monsoon, there is a significant decrease (down to 0.16 g/L), mostly as a result of increased flow and dilution from rainfall. Intermediate values (up to 5.2 g/L) during the post-monsoon indicate that sediments may have been resuspended, maybe as a result of groundwater flow or bank erosion. The high values in the pre- and post-monsoon periods may hinder turbidity-sensitive aquatic activities, including photosynthesis, and these changes reflect seasonal sediment dynamics [26]. Increased levels of total solids during the non-monsoon seasons have a substantial effect on the riverine systems. Elevated total solids increase the turbidity in the river, thereby causing a reduction in the penetration capacity of light particles necessary for photosynthesis in aquatic plants [27]. High suspended solid content in the water bodies clogs the gills of fish [28]. In addition to the direct effects on the living organisms, the higher particulate content facilitates the transport of nutrients and other pollutants, thereby altering the riverine ecosystems [29].
Natural organic matter, particularly aromatic chemicals like fulvic and humic acids, can be identified by OD254 [30]. Optical Density of the riverine systems measured in terms of OD254 is presented in Table 4. Moderate pre-monsoon levels (0.052–0.113) show a background of organic matter from natural debris and small inflows of garbage. During the monsoon, high amounts of labile organic matter are introduced via stormwater runoff, agricultural leachates, and urban drainage, which is probably why peaks were seen at S2 (0.222) and S3 (0.173). In the post-monsoon season, Stabilization took place (0.1–0.2), but consistently high levels imply either insufficient flushing or continuous organic inputs, maybe from wastewater or decomposing vegetation [31]. These readings, especially in slower-flowing passages, indicate a possible danger of oxygen deprivation and microbial development.
Table 4. DO values corresponding to the Pre Monsoon, Monsoon, and Post Monsoon seasons
|
Site |
Pre Monsoon |
Monsoon |
Post Monsoon |
|
S1 |
0.113 |
0.151 |
0.1 |
|
S2 |
0.111 |
0.221 |
0.2 |
|
S3 |
0.052 |
0.173 |
0.1 |
|
S4 |
0.061 |
0.111 |
0.1 |
|
S5 |
0.065 |
0.112 |
0.1 |
|
S6 |
0.061 |
0.142 |
0.1 |
|
S7 |
0.064 |
0.133 |
0.1 |
|
S8 |
0.071 |
0.079 |
0.1 |
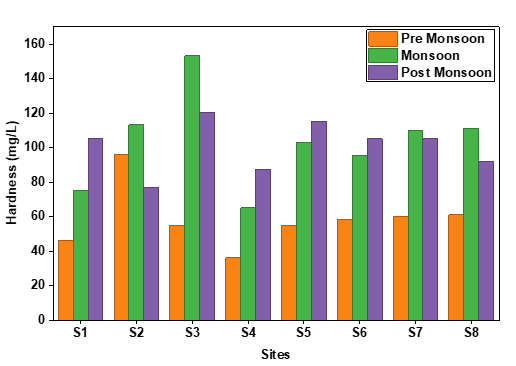
Water hardness demonstrated notable seasonal fluctuation, as represented in Figure 3. Before the monsoon, moderate hardness (46–96 mg/L) was observed with little leaching, and base flow played a role. The monsoon season shows a noticeable rise (up to 153 mg/L at S3), most likely brought on by upland floods, erosion of catchment rocks, and mineral leaching caused by runoff. After the monsoon, the water was persistently high (77.7–120 mg/L), indicating a gradual release from mineralized soil and a recovery of groundwater. Although the hardness levels stayed within reasonable bounds, they clearly show a mineral-rich post-monsoon nature that might influence the expansion of irrigation systems and residential applications [32].
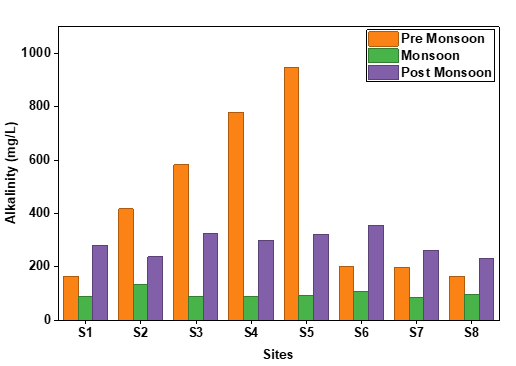
The most notable fluctuation was in alkalinity, which represents the water's buffering ability. Alkalinity of water during pre-monsoon, monsoon, and post-monsoon seasons is presented in Figure 4. Strong buffering, probably caused by accumulated bicarbonates and carbonates, driven by evaporation and concentration effects, is indicated by the exceptionally high pre-monsoon levels (up to 945 mg/L at S5). During the monsoon, a significant decrease was observed (down to 86.6 mg/L) as a result of ionic concentrations being diluted. Alkalinity recovered (232–355 mg/L) post the monsoon, which may have been caused by base flow and groundwater contributions. Extremely high alkalinity can alter metal solubility and the balance of aquatic ecosystems, even while it increases resilience to pH swings [33]. High alkalinity in irrigation water results in higher pH and increased sodium absorption, which disrupts the soil quality [34].
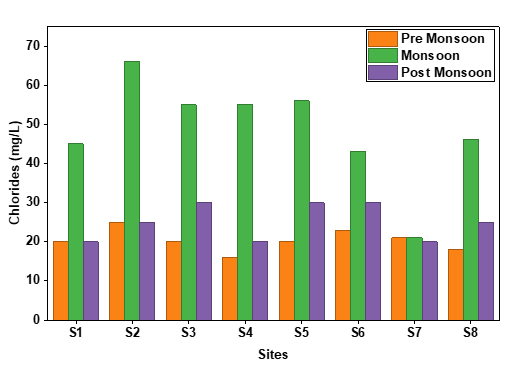
The variations in chloride levels in the riverine system are presented in Figure 5. Chlorides showed seasonal enrichment and the lowest concentrations (16.66–24.99 mg/L) before the monsoon. Monsoon peak levels (66.6 mg/L at S2) may be caused by home sewage, flood mobilization of soil salts, and runoff from both urban and rural areas. Higher values (up to 29.9 mg/L) were sustained post the monsoon, indicating limited dilution and possible human effects (e.g., fertilizers, detergent residues). If left uncontrolled, elevated chloride levels might endanger crop output and the flavour of drinkable water. When water comprising high chloride levels is used for irrigation, it leads to soil salinization, resulting in reduced agricultural productivity [35], [36]. On the other hand, consumption of water with high chlorine content can lead to high blood pressure [37].
Station S3 continuously displayed higher values for DO (monsoon), total solids (pre- and post-monsoon), and hardness across the three seasons, suggesting localized geogenic or human impacts. Elevated levels of organic markers (OD254 and chlorides) at Station S2 pointed to possible agricultural runoff or wastewater inputs. PCA was primarily carried out to improve the dimensionality of the data set to further analyze the most prominent parameter in the water quality, as represented in Figures 6 and 7.
4.2 Multivariate Statistical Analysis
The multivariate analysis conducted using HCA (Figure 6) and PCA (Figure 7) demonstrates clear seasonal trends in the water quality at the sites of sampling. At pre-monsoon, the PCA biplot shows that water quality is highly determined by factors like DO, OD254 (organic matter), hardness, and chlorides. Particularly, the sampling location S2 is strongly differentiated from all the others and has a high association with hardness and OD254, indicating high organic and mineral content levels. Likewise, S1 with greater DO and OD254, and S3 and S4 represent alkaline environments. This is supported by HCA, which also splits the locations into three distinct major clusters but isolates S2 because it uniquely has an exclusive water chemistry. The pre-monsoon dendrogram showed distinct clusters, forming groups of upstream and downstream sites, possibly due to anthropogenic activities and different sources of input. These findings align with previous studies that focus on the importance of organic pollution and mineral transport in river ecosystems during seasonal changes [27]–[29]. During the monsoon period, the pattern of sampling locations changes significantly, possibly due to enhanced runoff and dilution effects.
The PCA indicates that alkalinity, total solids, and chlorides gain more prominence, and although S2 remains distinct, other locations, such as S3, now cluster more with total solids and hardness, perhaps because of the influx of sediments and minerals. Sites S5, S6, S7, and S8 show a wider spread, reflecting the differential impacts of rainfall at different locations. The dendrogram using HCA shows a more even clustering with a significant grouping of S5, S6, S7, and S8, reflecting that these sites have similar monsoonal influences on water quality. Monsoon season revealed predominantly seasonal clustering patterns, highlighting the influence of surface runoff.
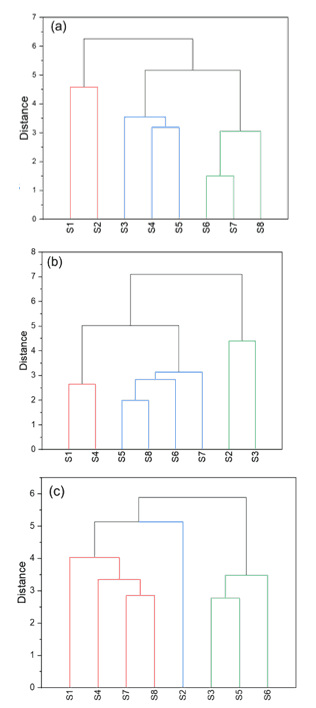
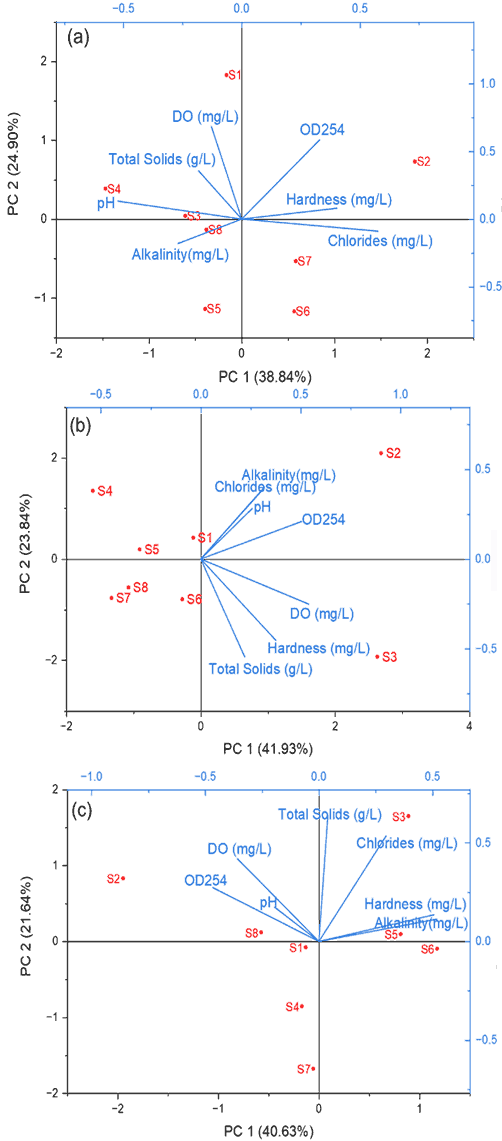
During the post-monsoon period, PCA shows a general merging of the sample locations around the centre of the biplot, which implies that there is a stabilization of water quality after the monsoon. S2 is still separated from the other points along the OD254, showing continued organic pollution. S3 is close to parameters such as total solids and chlorides, which indicate lingering effects of sedimentation due to the monsoon. Most other sites, including S1, S4, and S6, cluster closely together, reflecting more uniform water quality conditions. This pattern is replicated in the HCA, where most sites fall into one compact cluster, whereas S2 and S3 exist as separate clusters based on residual deviations in their chemical profiles. During the post-monsoon phase, the effects of accumulated pollutants were observed in the clustering patterns. The analysis shows that site S2 systematically differs from other sites, probably because of ongoing pollutant input, and that seasonal processes like rainfall and runoff have a major impact on water chemistry. Pre-monsoon condition depicts greater amounts of organics and minerals, monsoon imposes heterogeneity via inputs from the outside, and post-monsoon conditions reveal relative stability. These results are essential to distinguish pollution origins and design specialized water management tactics. HCA further corroborated these findings by grouping sites with similar water characteristics.
Water quality parameters play a determining role in defining the ecological health. The observed levels of contaminants have direct implications for agriculture and human health. Elevated levels of chlorine, although not immediately toxic, can lead to gastrointestinal disruptions in humans. On the other hand, agricultural lands are subjected to soil structure disruption. DO levels falling below the threshold limits cause poor growth and an increased mortality rate in fish. Higher total solids in the riverine systems reduce the oxygen levels, harming fish while also facilitating contaminant mobility. The water quality parameters play an intricate role in agriculture, human well-being, and the environmental system's health. Continuous monitoring of these parameters is necessary to ensure water security ensuring sustainable water resource management.
5. Conclusions
The seasonal assessment of water quality measurements across the Godavari River Basin reveals the temporal variations caused by hydrological conditions. High levels of total solids, alkalinity, and hardness during the pre-monsoon season suggest significant evaporation and reduced dilution, which was likely aggravated by low flow conditions. The monsoon season, on the other hand, exhibits a noticeable increase in measures like DO and decreased total solids, which are suggestive of improved aeration, dilution, and runoff-induced pollution flushing. Nonetheless, some organic indicators (OD254) increased in particular locations, suggesting that organic materials may have contributed to surface runoff. Although most measures showed a mild recovery in the post-monsoon season, alkalinity and hardness showed a revival at some locations, which may have been caused by delayed leaching or groundwater interaction. These findings demonstrate how riverine water quality is dynamic and responds to seasonal variations, highlighting the necessity of ongoing monitoring and catchment-specific management techniques to maintain sustainable water quality all year long.
Acknowledgments
The authors would like to acknowledge Mahindra University for its support through an internal research grant on the Water Quality monitoring over the Lower Godavari River basin.
References
[1] D. V. Dhawan, "Water and Agriculture in India," South Asia Expert panel Dur. Glob. Forum Food Agric. 2017, vol. 28, pp. 80-85, 2017, [Online]. Available: View Article
[2] S. Das, A. M. Kandekar, and S. J. Sangode, "Natural and anthropogenic effects on spatio-temporal variation in sediment load and yield in the Godavari basin, India," Sci. Total Environ., vol. 845, p. 157213, Nov. 2022, doi: 10.1016/J.SCITOTENV.2022.157213. View Article
[3] M. S. Pragathi, M. Anitha, G. Sreenivasulu, and N. Jayaraju, "Sustainable Aquaculture and Economic Development in Coastal Areas: The Case of Andhra Pradesh, India," Coasts, Estuaries Lakes Implic. Sustain. Dev., pp. 393-404, Jan. 2023, doi: 10.1007/978-3-031-21644-2_24. View Article
[4] S. Navasakthi et al., "Assessment of Spatial and Temporal Variation in Water Quality for the Godavari River," Water (Switzerland), vol. 15, no. 17, p. 3076, 2023, doi: 10.3390/w15173076. View Article
[5] A. S. Parab, M. Ghose, C. S. Manohar, and S. Neetu, "Monsoon-Driven Variability in Water Quality Index and Microbial Pollution Influencing the Carrying Capacity of the Mandovi-Zuari Estuarine System, Goa, India," Estuaries and Coasts, vol. 48, no. 5, pp. 1-20, Sep. 2025, doi: 10.1007/S12237-025-01588-Z/METRICS. View Article
[6] S. P. Gorde and M. V Jadhav, "Assessment of Water Quality Parameters : A Review," Int. J. Eng. Res. Appl., vol. 3, no. 6, pp. 2029-2035, 2013. View Article
[7] O. Bozorg-Haddad, M. Delpasand, and H. A. Loáiciga, "Water quality, hygiene, and health," Econ. Polit. Soc. Issues Water Resour., pp. 217-257, Jan. 2021, doi: 10.1016/B978-0-323-90567-1.00008-5. View Article
[8] Mohd Khairul Amri Kamarudin, "Seasonal Variation on Dissolved Oxygen, BiochemicalOxygen Demand and Chemical Oxygen Demandin Terengganu River Basin, Malaysiadrinking water (Manda and Das 2011). Water has its own criteria for composition and purity for various uses, and each body of wat," J. Environ. Sci. Manag., vol. 7, no. December, pp. 1-7, 2020. View Article
[9] H. Pia, M. Aktar, S. Sarkar, and A. Rahman, "Assessment of Water quality varies between pre- monsoon and post-monsoon season of the typical contaminated ...," Int. J. Agric. Environ. Bioresearch, vol. 3, no. February 2022, pp. 129-141, 2018. View Article
[10] M. Arienzo et al., "Influence of monsoon season on heavy metal composition of Hooghly River estuary sediments, West Bengal, India," J. Geochemical Explor., vol. 248, p. 107181, May 2023, doi: 10.1016/J.GEXPLO.2023.107181. View Article
[11] J. K. Ganeshkar, N. K. Marathe, P. G. Shinde, and Y. S. Kumawat, "Water Quality Assessment of Godavari River," Int. J. Sci. Res. Eng. Technol., vol. 4, no. 02, pp. 158-163, doi: 10.59256/ijsreat.20240402027. View Article
[12] P. V. Nageswara Rao, S. Appa Rao, and N. Subba Rao, "Suitability of groundwater quality for drinking, irrigation and industrial purposes in the Western Delta Region of the River Godavari, Andhra Pradesh," J. Geol. Soc. India, vol. 86, no. 2, pp. 181-190, 2015, doi: 10.1007/s12594-015-0297-1. View Article
[13] S. M. Shravan Kumar, M. Pandey, and A. K. Shukla, "Spatio-temporal analysis of riverbank changes using remote sensing and geographic information system," Phys. Chem. Earth, Parts A/B/C, vol. 136, p. 103692, Dec. 2024, doi: 10.1016/J.PCE.2024.103692. View Article
[14] S. Naik, R. K. Mishra, K. C. Sahu, A. A. Lotliker, U. S. Panda, and P. Mishra, "Monsoonal Influence and Variability of Water Quality, Phytoplankton Biomass in the Tropical Coastal Waters - A Multivariate Statistical Approach," Front. Mar. Sci., vol. 7, no. August, pp. 1-14, 2020, doi: 10.3389/fmars.2020.00648. View Article
[15] U. K. Pradhan, A. Ram, B. Sahu, P. B. Udayakrishnan, S. Lonkar, and L. Kumbhar, "Multivariate assessment of outflow water quality in highly urbanized creek system: implication of natural and anthropogenic processes," Environ. Sci. Pollut. Res., vol. 28, no. 36, pp. 49725-49742, Sep. 2021, doi: 10.1007/S11356-021-14128-6/METRICS. View Article
[16] A. Solutions, A. Solutions, and I. Solutions, "A.Ph.A.," J. Am. Pharm. Assoc. (Practical Pharm. ed.), vol. 15, no. 9, pp. 542-544, 1954, doi: 10.1016/s0095-9561(16)33485-5. View Article
[17] A. C. Rencher, "A Review Of 'Methods of Multivariate Analysis, Second Edition,'" IIE Trans., vol. 37, no. 11, pp. 1083-1085, Nov. 2005, doi: 10.1080/07408170500232784. View Article
[18] S. Shrestha and F. Kazama, "Assessment of surface water quality using multivariate statistical techniques: A case study of the Fuji river basin, Japan," Environ. Model. Softw., vol. 22, no. 4, pp. 464-475, Apr. 2007, doi: 10.1016/J.ENVSOFT.2006.02.001. View Article
[19] P. Tatavarthi, K. Katam, P. Sharma, and P. Singh, "Assessing Downstream Heavy Metal Contamination and Risks in the Godavari River Basin: Implications for Irrigation and Water Quality Management," J. Irrig. Drain. Eng., vol. 151, no. 3, p. 04025007, Feb. 2025, doi: 10.1061/JIDEDH.IRENG-10484. View Article
[20] A. L. Riscassi, T. M. Scanlon, and J. N. Galloway, "Factors influencing seasonal chemistry patterns in Virginia mountain streams," Biogeochemistry, vol. 167, no. 10, pp. 1175-1201, Oct. 2024, doi: 10.1007/S10533-024-01163-X/TABLES/2. View Article
[21] P. Padmavathi and R. Birudu, "Interlinking of Krishna and Godavari rivers: An ecological study Sustainable Aquaculture View project Malacofauna View project," Int. J. Fish. Aquat. Stud., vol. 4, no. February, pp. 593-595, 2019, [Online]. Available: https://www.researchgate.net/publication/331023508 View Article
[22] J. Klassen and D. M. Allen, "Assessing the risk of saltwater intrusion in coastal aquifers," J. Hydrol., vol. 551, pp. 730-745, Aug. 2017, doi: 10.1016/J.JHYDROL.2017.02.044. View Article
[23] J. M. Tellier, N. I. Kalejs, B. S. Leonhardt, D. Cannon, T. O. Hӧӧk, and P. D. Collingsworth, "Widespread prevalence of hypoxia and the classification of hypoxic conditions in the Laurentian Great Lakes," J. Great Lakes Res., vol. 48, no. 1, pp. 13-23, Feb. 2022, doi: 10.1016/j.jglr.2021.11.004. View Article
[24] A. Luo, H. Chen, X. Gao, L. Carvalho, H. Zhang, and J. Yang, "The impact of rainfall events on dissolved oxygen concentrations in a subtropical urban reservoir," Environ. Res., vol. 244, p. 117856, Mar. 2024, doi: 10.1016/J.ENVRES.2023.117856. View Article
[25] P. Babuji, S. Thirumalaisamy, K. Duraisamy, and G. Periyasamy, "Human Health Risks due to Exposure to Water Pollution: A Review," Water 2023, Vol. 15, Page 2532, vol. 15, no. 14, p. 2532, Jul. 2023, doi: 10.3390/W15142532. View Article
[26] O. Melnyk and A. Brunn, "Seasonal and Long-Term Water Regime Trends of Cheremsky Wetland: Analysis Based on Sentinel-2 Spectral Indices and Composite Indicator Development," Remote Sens. 2025, Vol. 17, Page 2363, vol. 17, no. 14, p. 2363, Jul. 2025, doi: 10.3390/RS17142363. View Article
[27] J. T. O. Kirk, "Effects of suspensoids (turbidity) on penetration of solar radiation in aquatic ecosystems," Hydrobiologia, vol. 125, no. 1, pp. 195-208, Jun. 1985, doi: 10.1007/BF00045935/METRICS. View Article
[28] X. C. Montoya, W. A. Thompson, C. M. Smith, J. M. Wilson, and M. M. Vijayan, "Exposure to Total Suspended Solids (TSS) Impacts Gill Structure and Function in Adult Zebrafish," Bull. Environ. Contam. Toxicol., vol. 113, no. 2, pp. 1-8, Aug. 2024, doi: 10.1007/s00128-024-03922-w. View Article
[29] S. Das, D. Pal, and A. Sarkar, "Particulate Matter Pollution and Global Agricultural Productivity," pp. 79-107, 2021, doi: 10.1007/978-3-030-63249-6_4. View Article
[30] A. Ukalska-Jaruga, R. Bejger, G. Debaene, and B. Smreczak, "Characterization of Soil Organic Matter Individual Fractions (Fulvic Acids, Humic Acids, and Humins) by Spectroscopic and Electrochemical Techniques in Agricultural Soils," Agron. 2021, Vol. 11, Page 1067, vol. 11, no. 6, p. 1067, May 2021, doi: 10.3390/AGRONOMY11061067. View Article
[31] S. Cai et al., "Dissolved organic matter transformation mechanisms and process optimization of wastewater sludge hydrothermal humification treatment for producing plant biostimulants," Water Res., vol. 235, p. 119910, May 2023, doi: 10.1016/J.WATRES.2023.119910. View Article
[32] V. S. Pitchaimani et al., Multivariate statistical and hydrogeochemical analysis of seasonal groundwater quality variations in coastal villages of Trivandrum district, south India, vol. 5, no. 1. Springer International Publishing, 2024. doi: 10.1007/s43621-024-00584-w. View Article
[33] N. Arora, S. Tripathi, G. P. Philippidis, and S. Kumar, "Thriving in extremes: harnessing the potential of pH-resilient algal strains for enhanced productivity and stability," Environ. Sci. Adv., 2025, doi: 10.1039/d4va00247d. View Article
[34] M. Selvamurugan, P. Balasubramaniam, M. Baskar, A. Alagesan, and M. J. Kaledhonkar, "Irrigation methods suitable for vegetable crops cultivation in sodic soil with alkaline irrigation water," Paddy Water Environ., vol. 22, no. 4, pp. 675-683, Oct. 2024, doi: 10.1007/S10333-024-00993-7/METRICS. View Article
[35] M. Hagage, A. M. Abdulaziz, S. F. Elbeih, and A. G. A. Hewaidy, "Monitoring soil salinization and waterlogging in the northeastern Nile Delta linked to shallow saline groundwater and irrigation water quality," Sci. Rep., vol. 14, no. 1, pp. 1-20, Dec. 2024, doi: 10.1038/s41598-024-77954-x. View Article
[36] H. A. Awaad, "Salinity and Its Impact on Sustainable Crop Production," in Earth and Environmental Sciences Library, Springer, Cham, 2023, pp. 29-92. doi: 10.1007/978-3-031-48542-8_2. View Article
[37] M. Ashrafuzzaman, C. Gomes, and J. Guerra, "The Changing Climate Is Changing Safe Drinking Water, Impacting Health: A Case in the Southwestern Coastal Region of Bangladesh (SWCRB)," Clim. 2023, Vol. 11, Page 146, vol. 11, no. 7, p. 146, Jul. 2023, doi: 10.3390/CLI11070146. View Article
[38] S. Dey, S. Botta, R. Kallam, R. Angadala, and J. Andugala, "Seasonal variation in water quality parameters of Gudlavalleru Engineering College pond," Curr. Res. Green Sustain. Chem., vol. 4, no. December 2020, p. 100058, 2021, doi: 10.1016/j.crgsc.2021.100058. View Article
[39] R. Sharma, A. Kumar, N. Singh, and K. Sharma, "Impact of seasonal variation on water quality of Hindon River: physicochemical and biological analysis," SN Appl. Sci., vol. 3, no. 1, pp. 1-11, Jan. 2021, doi: 10.1007/S42452-020-03986-3/TABLES/3. View Article
[40] W. Ojok, J. Wasswa, and E. Ntambi, "Assessment of Seasonal Variation in Water Quality in River Rwizi Using Multivariate Statistical Techniques, Mbarara Municipality, Uganda," J. Water Resour. Prot., vol. 09, no. 01, pp. 83-97, 2017, doi: 10.4236/jwarp.2017.91007. View Article