International Journal of Environmental Pollution and Remediation (IJEPR)
ISSN: 1929-2732

Volume 13 - Year 2025 - Pages 29-35
DOI: 10.11159/ijepr.2025.004
Analysis of PM Concentrations in Turin: Annual Trend and Monthly and Daily Mean Concentration
Davide Gallione1, Nicole Mastromatteo1, Marina Clerico1
1Politecnico Di Torino, DIATI – Department of Environment, Land and Infrastructure Engineering,
Corso Duca degli Abruzzi, 24, Turin, Italy
davide.gallione@polito.it; nicole.mastromatteo@polito.it; marina.clerico@polito.it
Abstract - As urban populations continue to grow, understanding the dynamics of particulate matter (PM) concentrations in these areas is increasingly important. This study investigated the temporal variations of PM1, PM2.5, and PM10 in the urban area of Turin, located in the Po Valley, Italy, utilizing high-resolution data from a monitoring campaign over a four-year period (2020–2024), focusing on identifying seasonal and weekly variations. The results revealed significant differences in PM concentrations between different seasons. The findings reveal a strong seasonality, with higher PM levels in winter due to domestic heating, traffic emissions, and adverse meteorological conditions, while summer months show lower concentrations. Winter concentrations often exceed WHO air quality guidelines, with PM10 levels surpassing EU annual thresholds, emphasizing the need for stricter emission control policies during colder months when pollution poses significant health risks. Weekly fluctuations in PM concentrations were also observed, with peaks mid-week and at the end of each week. These fluctuations are likely influenced by human activities and meteorological factors, suggesting that interventions targeting specific periods could help reduce pollution levels. The use of the Palas Fidas 200S instrument, with its high temporal resolution, allowed for detailed examination of daily and hourly trends, offering insights into the dynamics of PM concentrations. These findings are critical for epidemiological studies examining the link between air pollution and public health outcomes, particularly cardiovascular diseases. This study aims to visualize an entire dataset, which is then useful as the first step in future studies that will correlate the data shown with epidemiological data, providing a comprehensive understanding of the effects of air pollution on human health. With this study, therefore, we want to visualize the importance of having and making public a dataset of many consecutive years in order to better characterize the urban environment in question (city of Turin) thus giving the scientific community the possibility to visualize trends over the years.
Keywords: Particulate matter, air quality, urban pollution, fix monitoring station, temporal variability.
© Copyright 2025 Authors - This is an Open Access article published under the Creative Commons Attribution License terms. Unrestricted use, distribution, and reproduction in any medium are permitted, provided the original work is properly cited.
Date Received: 2025-01-13
Date Revised: 2024-05-26
Date Accepted: 2025-06-05
Date Published: 2025-06-16
1. Introduction
Air pollution can cause a number of harmful health effects, including premature mortality. An estimated 6.7 million deaths per year are attributed to air pollution globally. Italy has the highest number of deaths caused by fine particulate matter; in 2020, premature deaths due to PM2.5 were reported to be 52,303, according to Eurostat sources. Air pollution impacts various pathophysiological processes both at the target organ level and systemically [1]. Beyond premature mortality, air pollution also contributes to morbidity, which refers to the number of disease cases recorded during a specific period in relation to the total population surveyed [2]. Understanding how particulate matter varies across space and time in different areas is essential for accurately assessing the health risks associated with air pollution [3]. Most epidemiological studies on short-term exposure have relied on daily or hourly variations in pollutant concentrations measured at air quality monitoring stations [4]. In 2004, the American Heart Association released its first scientific statement on “Air Pollution and Cardiovascular Disease”, concluding that exposure to particulate matter contributes to cardiovascular morbidity and mortality. At the national level, Italy’s Istituto Superiore di Sanità (ISS) recently updated the “Sentieri” report, which examines mortality and morbidity among residents in areas of national interest (SIN). Alongside epidemiological evidence linking air pollution to oncological and respiratory diseases, the report highlighted excess hospitalizations for circulatory system diseases in both sexes, as well as ischemic heart disease and cardiovascular diseases, even at a young age [1]. In recent years, the number of time-series studies investigating associations between daily mortality, morbidity, and ambient concentrations of PM10 and PM2.5 has grown significantly [2].
Studies confirm that a 10 μg/m³ increase in PM10 raises the risk of hospitalization for myocardial infarction (MI) [5], while short-term exposure to high PM2.5 levels increases MI risk within hours in high-risk populations. Elevated PM2.5 levels are linked to a higher incidence of atherosclerosis. Short-term PM increases are associated with ischemic stroke, cardiac ischemia, and coronary disease, as well as variations in blood pressure [6]. Fine particulate inhalation may also raise the risk of deep vein thrombosis and blood clotting [6]. Mechanisms include endothelial dysfunction, platelet activation, and coagulation changes, contributing to plaque instability, rupture, and clot formation, potentially leading to MI or stroke [6].
Specifically, a 10 μg/m³ increase in PM concentrations has been shown to correlate with an increased risk of hospitalization on the same day or the day following exposure in most studies. Studies such as that of [7] have shown effects up to 2-3 days later, and rarely up to 5 days after exposure [8]. It is also significant to note that an increased risk of hospitalization was observed in the hour immediately following a 10 μg/m³ increase in PM concentration [9]. These results suggest the importance of considering both a daily and hourly time scale in future analyses.
The present study is positioned as a complementary part of a larger study including both concentration and epidemiological data, giving the possibility to provide an in-depth understanding of the impact of air pollution on human health. This study investigated the temporal and spatial variabilities of PM1, PM2.5, and PM10 over the urban area of Turin in the Po Valley, Italy, based on high-resolution data from the monitoring station of University of Turin Polytechnic (DIATI) CC-Green-Roof-Lab working since 2018. In particular, the years 2020 to 2024 were analysed.
2. Material and methods
PM data, used for this study, were acquired from the CC-Green-Roof-Lab, an open-air laboratory. In particular, the Palas Fidas 200S instrument was used.The Palas Fidas 200S analyzer is an instrument that can measure the concentration of solid particles ranging in size from 18 µm to 0.18 µm. The parameters acquired are PM1, PM2.5, PM4, PM10, and PTS. Therefore, it is specified that PM1 is represented only by the portion of particulate matter with size between 0.18 µm and 1 µm, hence are not to be considered as ultra-fine particles since the size range of ultra-fine particles is 0.01 µm – 0.1 µm. The external configuration of the instrument includes a stainless-steel container to protect it from the weather and keep the instrument at an optimal temperature for measurements. The instrument is equipped with a sensor and an optical spectrometer that allows the definition of the number of aerosol particles and their size, thanks to the scattering phenomenon. The sampling head can capture a flow of 0.3 m3/h and enables representative measurements even in intense wind, thanks to the Sigma-2 sampling head with VDI 2119-4. The instrument is equipped with an IADS (Intelligent Aerosol Drying System), from Palas GmbH Germany, as well as sensors for measuring the temperature, air pressure, and relative humidity. The IADS prevents incorrect measurements caused by condensation effects in areas with high humidity. The temperature must be kept higher than the dew temperature, which is why a mechanism inside the drying line regulates it according to the external temperature, pressure, and rH [10].
The Palas Fidas 200S is an optical spectrometer designed for air pollution monitoring and certified according EN 16450 that approved fine dust aerosol spectrometer for simultaneous measurement of PM2.5 and PM10 in weatherproof cabinet for outdoor installation. The device’s measuring is verified and calibrated every three months.
The objective of the proposed analysis is to identify the exceeding of the concentration limits and the critical periods in which the greatest increases in PM concentrations occurred, in order to make the results available for future epidemiological studies and, specifically, to be able to make the correlation between exceedances and hospital admissions for cardiovascular-related problems. In order to understand the evolution of particulate concentrations over time, graphs representing the trend of the PM1, PM2.5 and PM10 fractions over the period under consideration were created using the Python programming environment. This shows the changes in concentrations on an hourly basis, highlighting any peaks and fluctuations over the course of the different seasons due mainly to domestic heating, heavy traffic and weather conditions. Thanks to the high temporal resolution of the data, it was possible to visualize specific conditions and analyze particular situations.
It is specified that there are interruptions within the entire dataset. These are due to periods of power grid maintenance or power grid malfunctions during which it was decided to interrupt the measurement so as not to damage the instrumentation.
3. Discussion and Results
In this study, trends in PM concentrations over approximately four years, from 2020 to 2024, are analyzed. Analyzing this very extensive time series, it can be seen that, almost cyclically, PM concentrations are higher in the winter periods and remain lower in the summer months, generating a repetitivity in the trend of concentrations over the years, this is very evident from Figure 1.
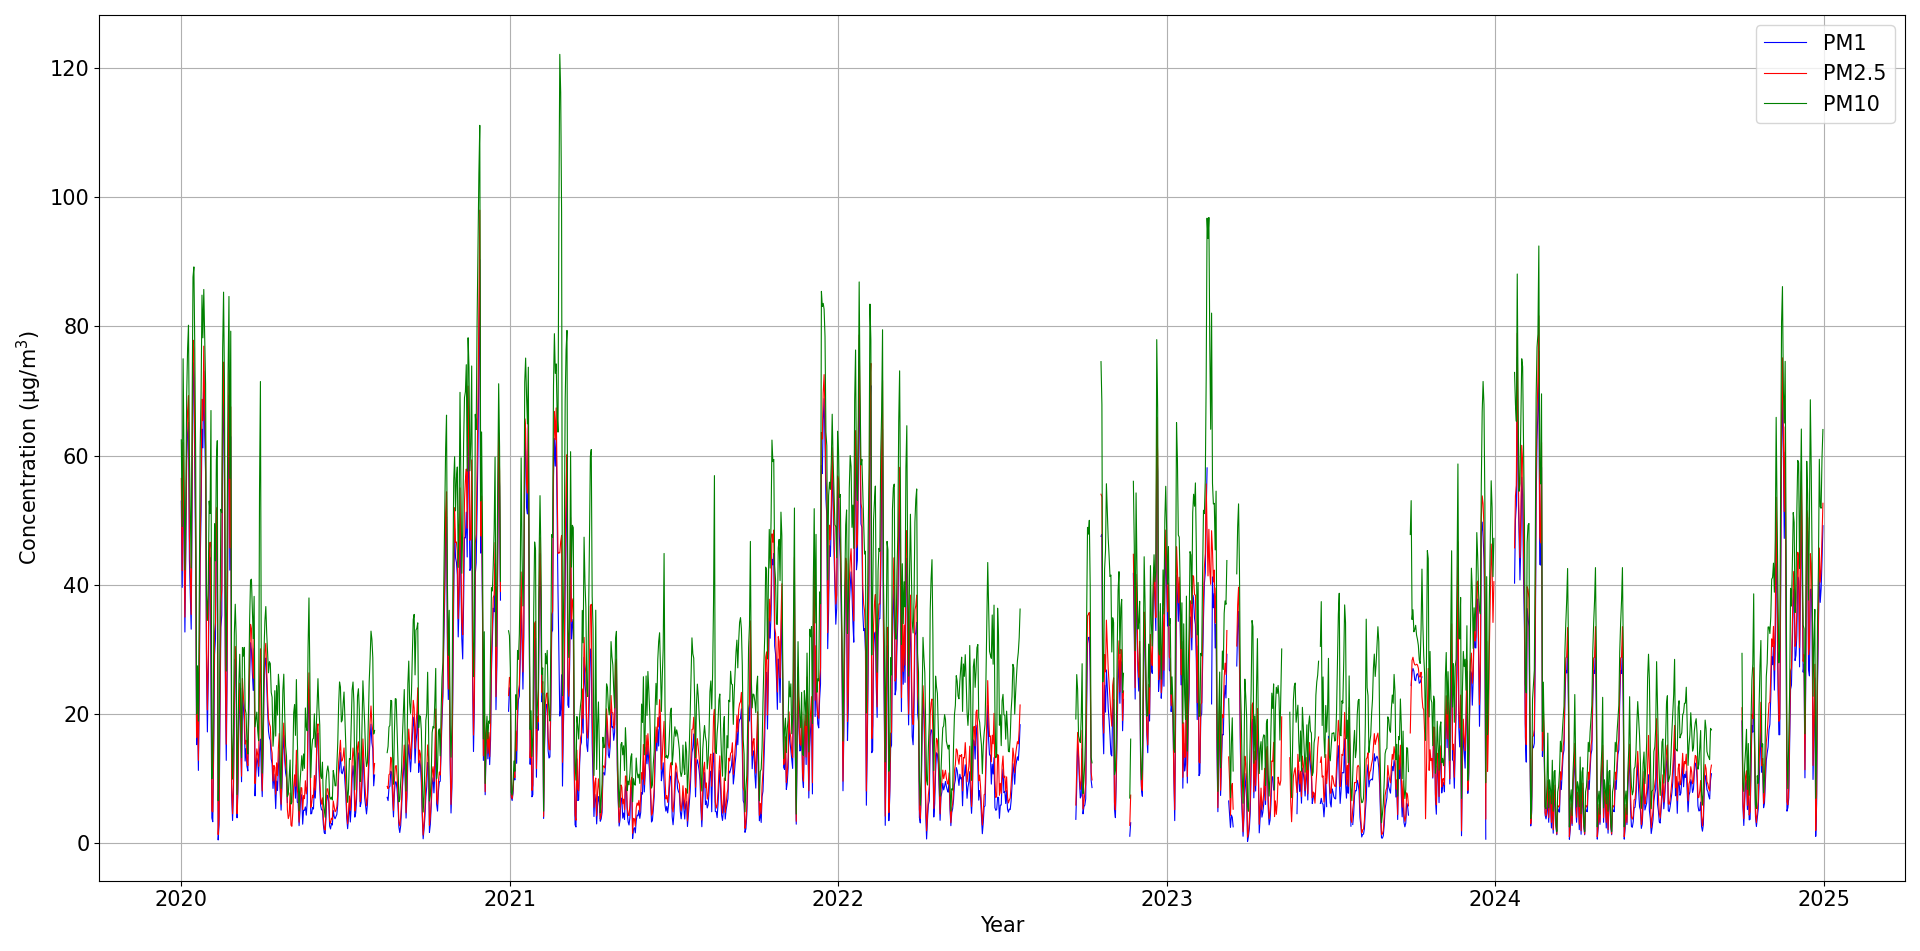
The Figure 1 represents the entire dataset from 2020 to 2024 of fine and coarse particles concentrations (PM1, PM2.5, and PM10) collected at the Politecnico di Torino with Palas Fidas 200S. It is possible to see how the concentrations follow a seasonal trend along the different years: this trend shows an increase of PM concentrations during the colder seasons and a lower value during the warmer seasons.
The scenario analyzed is an urban scenario represented by the metropolitan city of Turin, located in the Piedmont region of northwestern Italy. Turin is exposed to the Po Valley in two directions and is surrounded by hilly relief on one side and the Alpine chain on the other [11]. This setting affects the city’s atmospheric stability, which in winter contributes to the high number of pollution events [12]. The local increase in concentrations in the winter months may be due to the increase in emissions from domestic heating and vehicular traffic during typical winter weather conditions that favor the accumulation of pollutants, but also due to the contribution from the Po basin from East to West [13]. PM1, PM2.5 and PM10 show rather similar trends, although the concentrations are different. In fact, PM10 has the highest peak concentrations compared to PM2.5 and PM1, which, with a few exceptions, show very close values. This suggests that PM1 and PM2.5 tend to behave more uniformly, whereas PM10, which includes larger particles, reaches more pronounced peaks, probably related to specific emission sources or local events such as dust uplift. Previous studies have analyzed the role of winter heating sources, such as domestic boilers, in the area under study and the entire Po Valley [14]. The concentration was lowest in the summer months, especially in May. The spring months showed a gradual reduction in concentrations, whereas the autumn months showed an increase. The same trend was also found by [15], [16]. Starting with the daily averages in the graph in Figure 2, monthly averages are presented to emphasize the already evident seasonality presented and explained above (Figure 2).
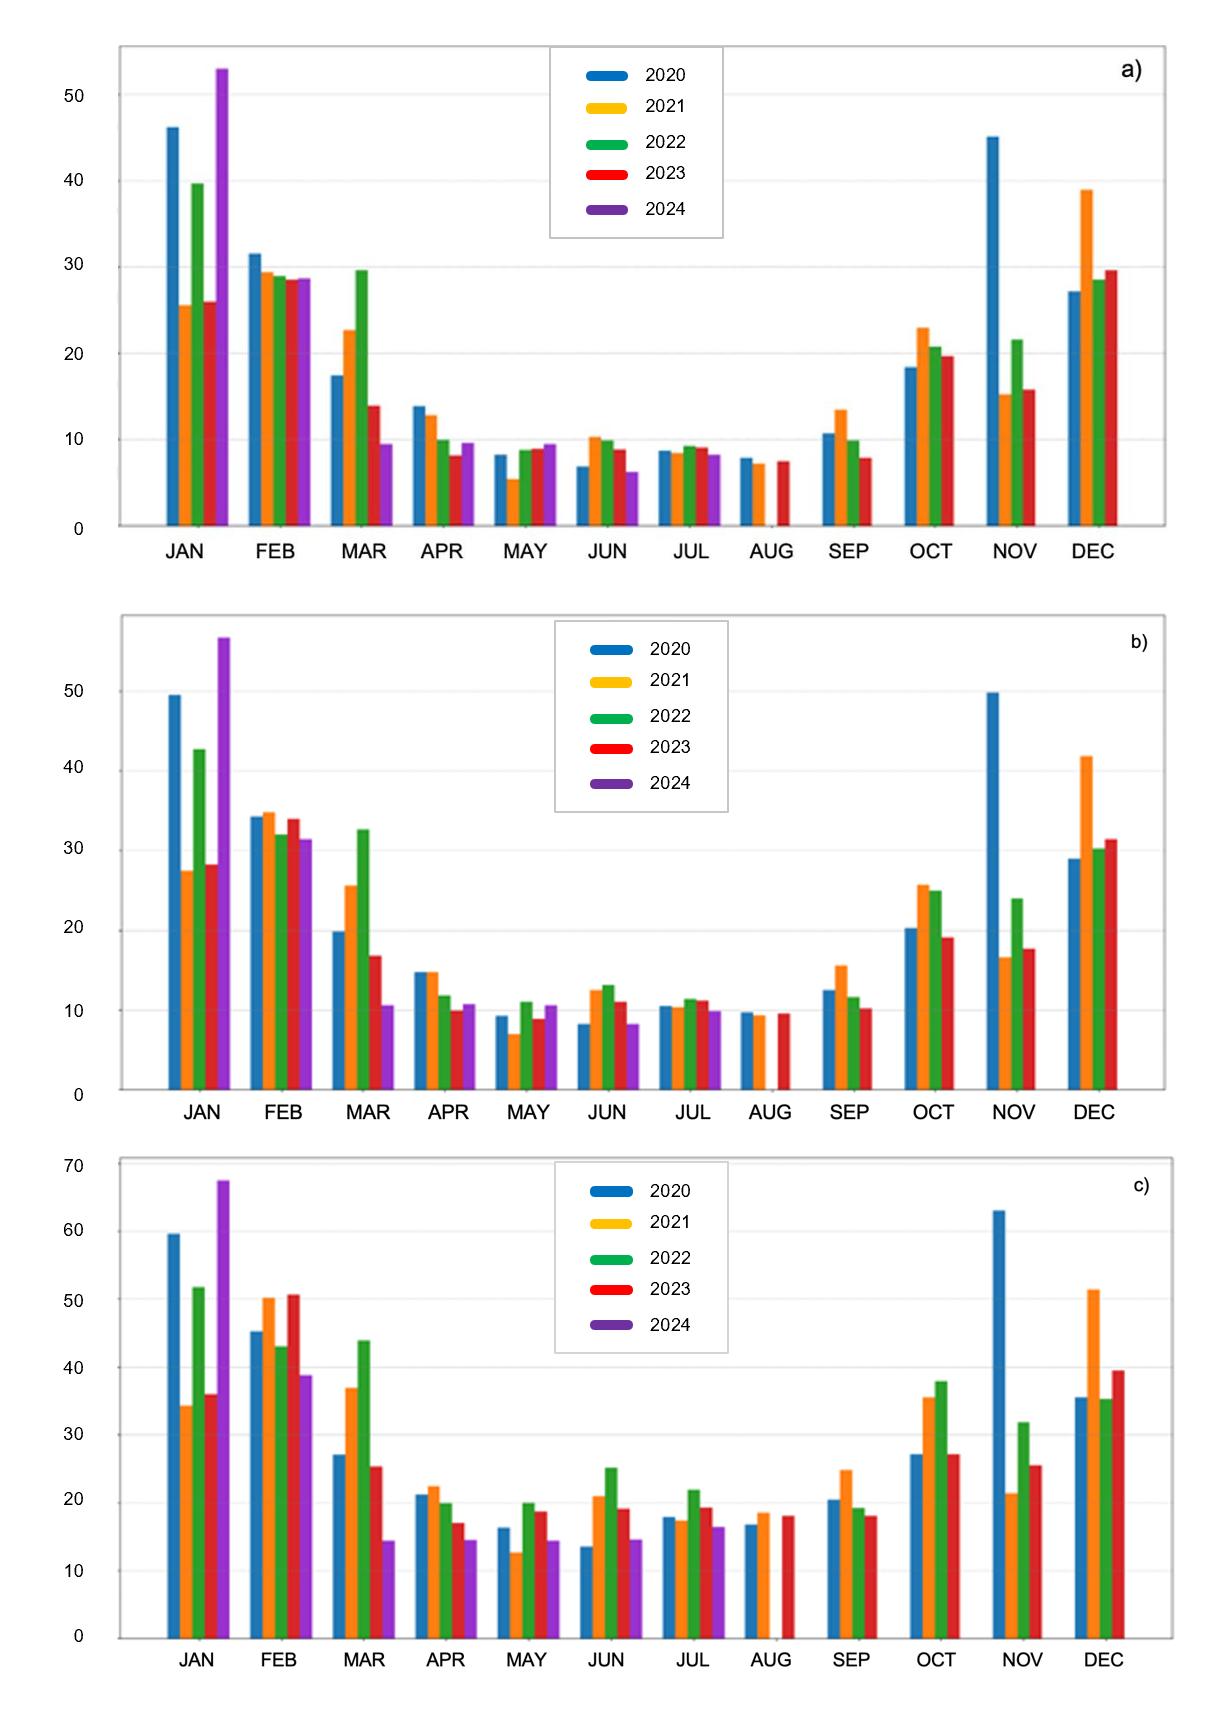
This enabled a deeper monthly-scale analysis to highlight specific pollution episodes. Each bar represents a monthly mean concentration in µg/m³. This happened in November 2020, when very high PM values were recorded. According to Arpa Piemonte data, in 2020, Turin reached 36 days of exceeding the limit of 50 µg/m³ of PM10, which is the maximum allowed by current regulations. This data shows how the city has frequently exceeded the legal limits for fine particles, posing a risk to public health. It is important to note that, although the restrictions related to the COVID-19 pandemic led to a reduction in industrial activities and traffic, air pollution continued to pose a significant challenge. Several studies have found that, during the lockdown, there was a decrease in higher PM10 concentrations, but not a uniform reduction in all pollutants [17]. To better highlight the differences between the wWarmest and cColdest sSeasons, further elaboration is proposed by considering seasonal averages for each year. Figure 3Figure 3 shows the average concentrations of PM1, PM2.5, and PM10, divided into winter months (October to March) and summer months (April to September) for the period 2020 to 2024.
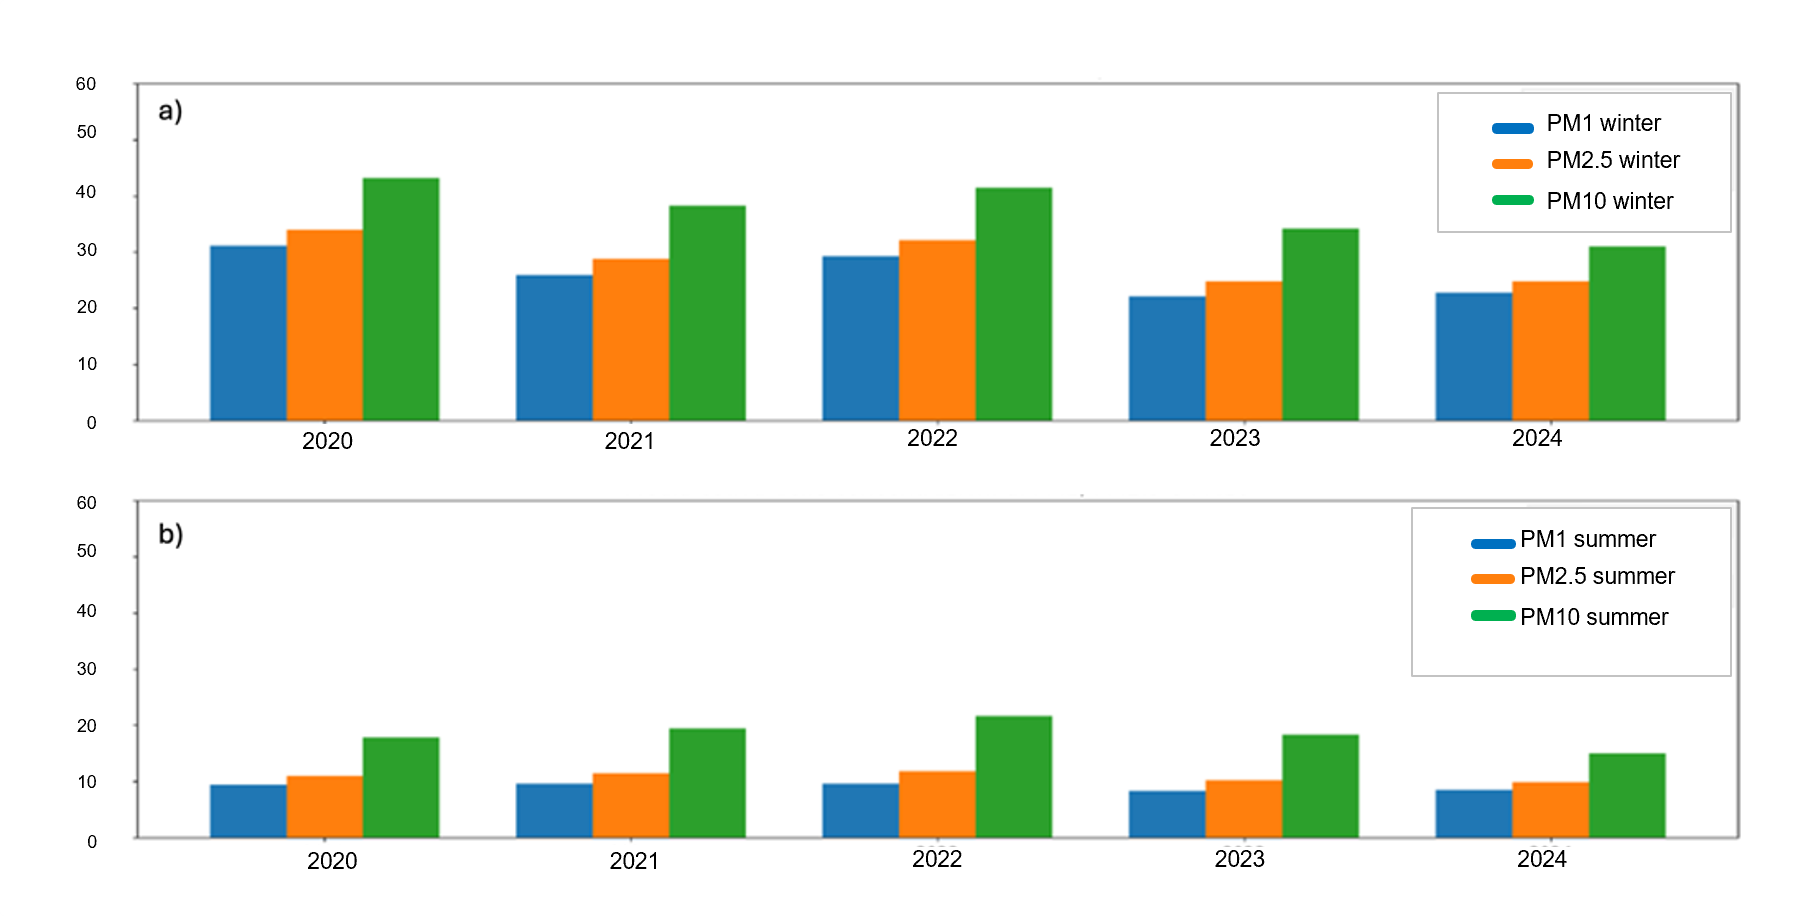
This chart aims to contextualize the data concerning current regulations and WHO air quality guidelines, with the goal of verifying whether winter conditions alone contribute to exceeding the annual limits set by various regulatory agencies. From the analysis of the graph, it is observed that during the winter months, the PM2.5 averages range between 20 and 30 µg/m³, consistently exceeding the new European annual threshold of 10 µg/m³. PM10 also shows winter averages well above the 20 µg/m³ annual limit established by the European Directive 2024/2881, with values exceeding 40 µg/m³ in certain years. During the summer months, although concentrations are generally lower, occasional exceedances of the 20 µg/m³ annual threshold for PM10 are observed, along with values close to or exceeding the 10 µg/m³ annual threshold for PM2.5. Moreover, it is evident that both in summer and winter, PM2.5 and PM10 concentrations significantly exceed the WHO guideline limits of 5 µg/m³ for PM2.5 and 15 µg/m³ for PM10. In particular, during the winter months, PM10 concentrations are more than twice the WHO limit. Finally, comparing the data with the current limits set by Legislative Decree 2881/2024, winter concentrations are generally above daily limits of 25 µg/m³; instead, values remain below this threshold during summer. Regarding PM10, winter averages frequently reach or exceed the 45 µg/m³ daily limit in the years 2020, 2021, and 2022 but they are respected during the 2023 and 2024. In summer, values generally remain below the 45 µg/m³ threshold. In general, there is a decrease in the mean value in the years 2023 and 2024 both in winter and in summer Figure 3.
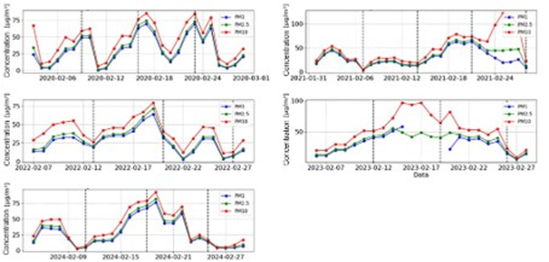
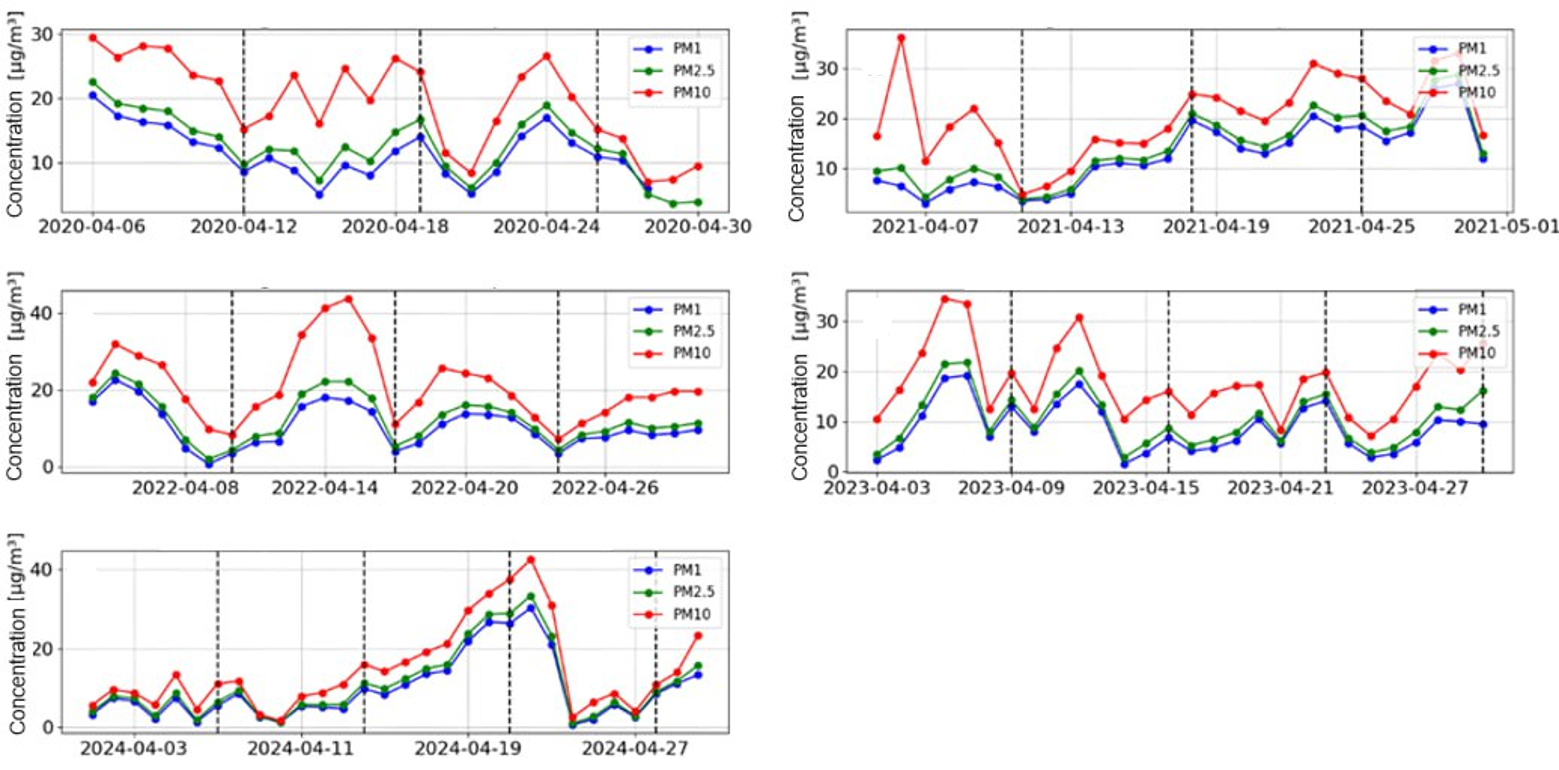
Figure 4 and Figure 5 illustrate the daily trends of particulate matter concentrations over one month, with different particulate fractions (PM10, PM2.5 and PM1). The end of each week is marked by a dashed black vertical line. Each graph starts from the first Monday and extends to the month's end, allowing visualization of entire weeks from Monday to Sunday. This approach helps to analyze weekly trends, compare patterns across days within the week, and examine differences across weeks over the five years considered in the analysis. This processing aims to viasualize a weekly trend for all years by considering the trend of the same month in different years.
In February, every years show peaks in PM concentrations around mid and late month. Specifically, in 2020, 2022, and 2024, significant increases are observed between February 11–17 and again around February 23–25. This suggests a possible weekly periodicity, with PM concentrations rising and falling in roughly seven-day intervals. For example, in 2020, a peak around February 12 is followed by a decrease and another increase around February 18. A similar trend is seen in 2022 and 2024. However, in 2021, the pattern appears less regular, with relatively stable concentrations until the latter half of the month, when a single major peak occurs between February 23–25. In 2023, concentrations begin to rise around February 8, remain high with minor fluctuations until February 20, and then drop sharply. While 2021 and 2023 deviate slightly from the weekly trend observed in other years, they still display some oscillatory behavior.
In April, variability is noted across years, but PM10 concentrations are consistently higher than PM2.5 and PM1. Some years exhibit periodic declines aligned with roughly weekly intervals. However, the overall pattern is irregular, making it difficult to establish a clear weekly trend. Notably, peaks often occur between April 10–20 in several years (e.g., 2022 and 2024), hinting at a possible but inconsistent weekly pattern.
5. Conclusion
This study analysed PM1, PM2.5, and PM10 concentrations in Turin over a four-year period (2020–2024), identifying critical periods and trends related to seasonal and weekly variations. The results highlight a clear seasonality in PM levels, with higher concentrations during the winter months due to domestic heating, vehicular emissions, and unfavourable meteorological conditions, and lower concentrations in summer. Winter PM concentrations consistently exceeded the WHO air quality guidelines, with PM10 levels frequently surpassing the European Union's annual thresholds.
These findings underscore the urgent need for stricter policies to control emissions, particularly during the colder months, when pollution levels pose a significant threat to public health. Moreover, the study observed periodic weekly fluctuations, with noticeable peaks occurring mid-week and towards the end of each week. This cyclic behaviour, likely linked to human activities and meteorological factors, emphasizes the importance of targeted interventions during specific periods to mitigate PM levels. The high temporal resolution of the Palas Fidas 200S instrument allowed for a detailed examination of daily and even hourly trends, providing valuable insights into the dynamics of PM concentrations. These findings are crucial for future epidemiological studies, particularly in assessing the correlation between air pollution exceedances and hospital admissions for cardiovascular diseases.
However, further investigations are needed to evaluate the impact of additional factors, such as industrial emissions and long-range transport of pollutants, as well as to explore mitigation strategies aimed at reducing PM concentrations in urban areas. In conclusion, this research contributes to the growing body of knowledge on air quality in urban environments and highlights the necessity of comprehensive monitoring programs and proactive measures to improve public health and environmental quality in the Po Valley region.
References
[1] A. Belfiore, P. Portincasa, e A. D. Ciaula, «INQUINAMENTO ATMOSFERICO, ATEROSCLEROSI E RISCHIO CARDIOVASCOLARE».
[2] F. R. Cassee, N. L. Mills, e D. E. Newby, Cardiovascular Effects of Inhaled Ultrafine and Nano-Sized Particles. Wiley, 2011. [Online]. Disponibile su: https://books.google.it/books?id=MfWhfiRkVaIC View Article
[3] Liu S, Tian H, Luo L, Bai X, Zhu C, Lin S, Zhao S, Zhang K, Hao J, Guo Z, Lv Y., «Health impacts and spatiotemporal variations of fine particulate and its typical toxic constituents in five urban agglomerations of China. Sci Total Environ. 2022 Feb 1;806(Pt 4):151459. doi: 10.1016/j.scitotenv.2021.151459. Epub 2021 Nov 4. PMID: 34742961.» View Article
[4] R. W. Atkinson et al., «Long-term exposure to ambient ozone and mortality: a quantitative systematic review and meta-analysis of evidence from cohort studies», BMJ Open, vol. 6, fasc. 2, p. e009493, feb. 2016, doi: 10.1136/bmjopen-2015-009493. View Article
[5] Zanobetti A, Schwartz J., «The effect of particulate air pollution on emergency admissions for myocardial infarction: a multicity case-crossover analysis. Environ Health Perspect. 2005 Aug;113(8):978-82. doi: 10.1289/ehp.7550. PMID: 16079066; PMCID: PMC1280336.» View Article
[6] G. Polichetti, S. Cocco, A. Spinali, V. Trimarco, e A. Nunziata, «Effects of particulate matter (PM10, PM2.5 and PM1) on the cardiovascular system», Toxicology, vol. 261, fasc. 1, pp. 1-8, 2009, doi: https://doi.org/10.1016/j.tox.2009.04.035. View Article
[7] J. A. Fisher et al., «Case-crossover analysis of short-term particulate matter exposures and stroke in the health professionals follow-up study», Environment International, vol. 124, pp. 153-160, mar. 2019, doi: 10.1016/j.envint.2018.12.044. View Article
[8] L. Wu et al., «Chemical composition-dependent hygroscopic behavior of individual ambient aerosol particles collected at a coastal site», Atmos. Chem. Phys., vol. 23, fasc. 19, pp. 12571-12588, ott. 2023, doi: 10.5194/acp-23-12571-2023. View Article
[9] S. Tabaghi et al., «Associations between short‐term exposure to fine particulate matter and acute myocardial infarction: A case‐crossover study», Clinical Cardiology, vol. 46, fasc. 11, pp. 1319-1325, nov. 2023, doi: 10.1002/clc.24111. View Article
[10] N. Mastromatteo, L. Drudi, D. Gallione, R. Bellopede, e M. Clerico, «Assessment of Environmental Parameters in Natural Coastal Scenery and Compositional by Means of an Innovative Approach», Atmosphere, vol. 15, fasc. 11, p. 1379, nov. 2024, doi: 10.3390/atmos15111379. View Article
[11] D. Mecca, C. Boanini, V. Vaccaro, D. Gallione, N. Mastromatteo, e M. Clerico, «Spatial variation, temporal evolution, and source direction apportionment of PM1, PM2.5, and PM10: 3-year assessment in Turin (Po Valley)», Environ Monit Assess, vol. 196, fasc. 12, p. 1251, dic. 2024, doi: 10.1007/s10661-024-13446-9. View Article
[12] D. Pernigotti, E. Georgieva, P. Thunis, e B. Bessagnet, «Impact of meteorology on air quality modeling over the Po valley in northern Italy», Atmospheric Environment, vol. 51, pp. 303-310, 2012, doi: https://doi.org/10.1016/j.atmosenv.2011.12.059. View Article
[13] H. Diémoz et al., «Transport of Po Valley aerosol pollution to the northwestern Alps - Part 1: Phenomenology», Atmos. Chem. Phys., vol. 19, fasc. 5, pp. 3065-3095, mar. 2019, doi: 10.5194/acp-19-3065-2019. View Article
[14] S. Gilardoni et al., «Spatial and Temporal Variability of Carbonaceous Aerosol Absorption in the Po Valley», Aerosol Air Qual. Res., vol. 20, fasc. 12, pp. 2624-2639, 2020, doi: 10.4209/aaqr.2020.03.0085. View Article
[15] T. Chen, J. He, X. Lu, J. She, e Z. Guan, «Spatial and Temporal Variations of PM2.5 and Its Relation to Meteorological Factors in the Urban Area of Nanjing, China», IJERPH, vol. 13, fasc. 9, p. 921, set. 2016, doi: 10.3390/ijerph13090921. View Article
[16] G. Xu et al., «Spatial and Temporal Variability of the PM2.5/PM10 Ratio in Wuhan, Central China», Aerosol Air Qual. Res., vol. 17, fasc. 3, pp. 741-751, 2017, doi: 10.4209/aaqr.2016.09.0406. View Article
[17] Deserti, M.; Raffaelli, K.; Ramponi, L.; Carbonara, C.; Agostini, C.; Amorati, R.; Arvani, B.; Giovannini, G.; Maccaferri, S.; Poluzzi, V., «Report COVID-19-Studio Preliminare Degli Effetti Delle Misure COVID-19 Sulle Emissioni in Atmosfera e Sulla Qualità Dell'aria nel Bacino Padano-Giugno 2020; Technical Report, prepAIR Project, 2020.» giugno 2020. [Online]. Disponibile su: Available online: View Article