International Journal of Environmental Pollution and Remediation (IJEPR)
ISSN: 1929-2732

Volume 12 - Year 2024 - Pages 58-65
DOI: 10.11159/ijepr.2024.007
Waste Minimization in Peanut Snack Production using Lean Manufacturing tools: a Case Study
Yadhira Nicole Aldave-Vasquez1, Stephanny Morales-Vargas2, Jorge Antonio Corzo-Chavez3
Facultad de Ingeniería, Universidad de Lima, Perú
Av. Javier Prado Este 4600, Santiago de Surco, Lima, Perú, 15023
120182218@aloe.ulima.edu.pe; 220182939@aloe.ulima.edu.pe, 3jacorzo@ulima.edu.pe
Abstract - This research project addresses the challenges of waste in a Small and Medium-sized Enterprises (SME) dedicated to the production of peanut snacks in Peru. Production waste, a persistent problem in production processes, has negatively impacted the company's operational efficiency and profitability. To overcome this problem, three fundamental engineering tools will be implemented: 5S, Informative Poka Yoke and Total productive maintenance (TPM).
The 5S methodology will be used to redefine and optimize work spaces, promoting organization and discipline at each stage of the production process. Informational Poka Yoke systems will be introduced to prevent and correct errors in real time, reducing the generation of production waste and improving consistency in the quality of the final product. Additionally, the TPM methodology focuses on reducing production waste in processes that involve machinery, using a simulator to address failures of said equipment
The main objective of this project is to significantly reduce waste in the production of peanut snacks, simultaneously improving the overall efficiency of the processes and guaranteeing high quality standards. The results obtained after the application of the three tools were positive. In the final 5S audit, an increase in the score was achieved, going from 37.6% in the initial stage to 90.4% in the final. The results of the Poka Yoke template showed reduced error rates: 4.25% in selection process, 2.86% in toasting and 2.73% in the semi-toasting. In the TPM simulator the availability of the machine was 98.45%. These achievements demonstrate the effectiveness of the strategies implemented in improving the efficiency and profitability of the production of peanut snacks in the SME company, Likewise, the company's environmental pollution was considerably reduced.
Keywords: 5S, Poka Yoke, TPM, Waste reduction.
© Copyright 2024 Authors - This is an Open Access article published under the Creative Commons Attribution License terms. Unrestricted use, distribution, and reproduction in any medium are permitted, provided the original work is properly cited.
Date Received: 2024-02-10
Date Revised: 2024-09-25
Date Accepted: 2024-10-07
Date Published: 2024-xx-xx
1. Introduction
Waste production is defined as the reduction of a product that occurs during a production process, due to temperature levels, humidity, water levels, machinery, operators, raw materials and other factors [1]. In the food industry, Waste production can vary considerably depending on the type of product being produced, as well as the manufacturing method.
According to the Food Loss and Waste Manual [2] there is generation of waste in the food industry, which turns into solid waste and negatively impacts the environment. In North America and Oceania the percentage is 3.4%, in Europe and Russian Federation is 3.9%; in Japan, the Republic of Korea and China it is 3.1%; in South and Sub-Eastern Asia it is 2.7%, in sub-Saharan Africa it is 4.5%, and in Latin America it is 5%.
A recent evaluation of food systems in Peru reveals that in 2017 deficiencies in the storage, distribution and marketing chain resulted in losses of 45% of production in cereals, roots, tubers, legumes, fruits and vegetables that They occur during the production stages (14%), post-harvest and storage (9%), processing and packaging (15%) and distribution (7%) [3].
The study company is dedicated to the production of salty peanut snacks, with sweet, spicy and mixed coverage; These products are marketed in different presentations, however, this research will focus on the presentation of a box of 144 packages of 38 g each, corresponding to the salted peanut production line.
The objectives of this research focus on identifying the critical points of the production process of the salted peanut snack, in order to implement improvement tools. Likewise, it seeks to reduce the loss generated throughout production, minimize environmental pollution, increase the units produced, and obtain higher income.
2. State of the art
A search was carried out for studies and articles that align with the topic and objectives of the research, obtaining 40 articles for the review; of which 3 documents stand out that served as the basis for this project.
Cubas et al. [4] seek to reduce failures, stops and unforeseen defects of the machines in a footwear company, using the TPM tool they managed to identify the problems that caused low efficiency in the machines and corrected them through more controlled and specific preventive maintenance, they also used 5s to improve the order within the production area, preventing transfers that delay production, ultimately obtaining an increase in productivity.
Hakim y Hellyward [5] carried out a diagnosis of the situation in order to solve and prevent errors using the Poka Yoke tool, what was obtained was a reduction in misalignment by 95% which avoided a greater number of the errors that were previously generated.
According to Vargas & Camero [6] The purpose of implementing Lean Manufacturing with a focus on 5S is to improve efficiency and performance in the adhesives production section of a manufacturing company, with the ultimate objective of increasing productivity. This methodology seeks to optimize processes and the work environment to achieve more effective and sustainable results.
3. Methodology
The research is quantitative because data was collected for the measurement of the variables, the scope of this research is descriptive and correlational, because the data collected by the company and important characteristics of the object of study are described, on the other hand, it was determined that the independent variable is the reduction of waste, and the dependent variable is the improvement of productivity. Data will be collected that will help analyze the relationship between these, in order to predict possible scenarios.
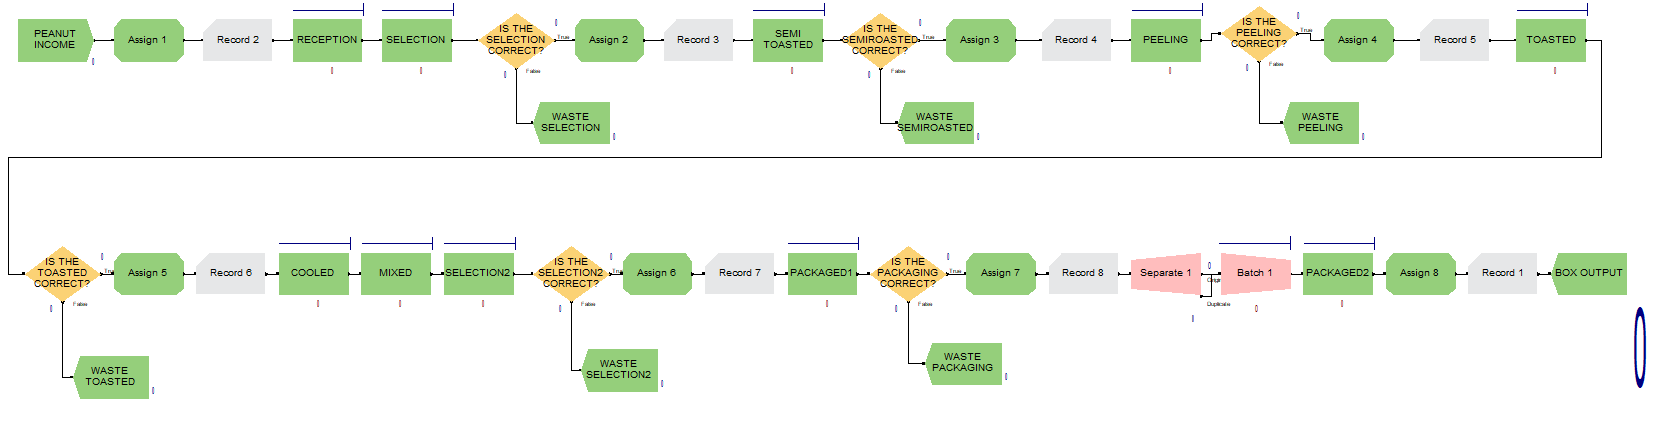
The main problem of the study company is the high percentage of waste generated in the productive activities of the salted peanut production line. As shown in Figure 1, the records, implementation process and expected results are described.
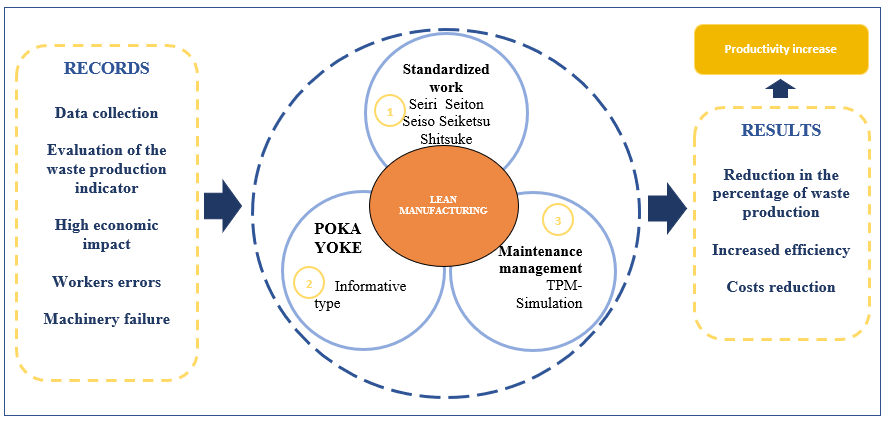
You can see in the graph the different records that the company presents, so when analyzing the problem and its main causes, it was decided to opt for the following solution tools, which are 5S, TPM and Poka Yoke with in order to reduce the percentage of waste and increase production productivity.
3.1. Tools implemented through pilot tests (5s and Poka Yoke)
5S is a tool that contributes to keeping the work environment clean and orderly, as well as improving staff productivity and therefore production. According to Burawat [7]. 5s has 5 steps:
- Seiri (Separate): The objects in the work area are classified, it is evaluated if each item is necessary and if it does not belong to the area it is removed.
- Seiton (Order): Each piece of equipment is delimited, the objects are labeled and placed in a suitable place.
- Seiso (Clean): Clean and remove dust from equipment and the work environment.
- Seiketsu (Standarize): Rules developed and updated to maintain control of the work area, these rules must be clear and direct.
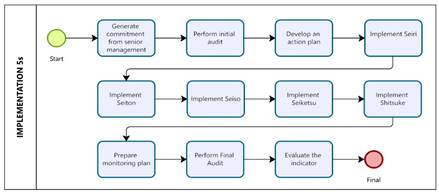
- Shitsuke (Discipline): It is the automatic implementation of the rules. As shown in Figure 2 this tool develops an improvement plan, an initial audit is carried out and then an action plan is developed, where Seiri, Seiton, Seiso, Seiketsu and Shitsuke are implemented; and finally a final audit.
As shown in Figure 2 this tool develops an improvement plan, an initial audit is carried out and then an action plan is developed, where Seiri, Seiton, Seiso, Seiketsu and Shitsuke are implemented; and finally a final audit.
On the other hand, due to the lack of specifications in the activities and in order to eliminate the occurrence of defects, it is proposed to use Poka Yoke, which serves to avoid human errors and correct inefficiencies in production processes since it acts as a quick and direct response. According to Andrada [8] Poka Yoke is classified into 4 types:
- Physical: Changes are made with certain devices to avoid errors.
- Sequential: An order or sequence is followed in the process.
- Grouped: It is a preparation of material kits to carry out an activity.
- Informative: Direct, clear and simple information is shown to the operator to correctly carry out the activity.
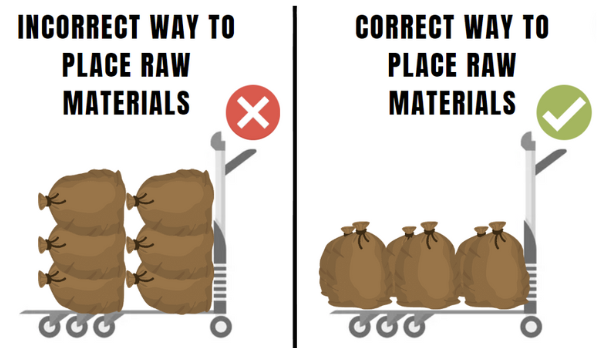
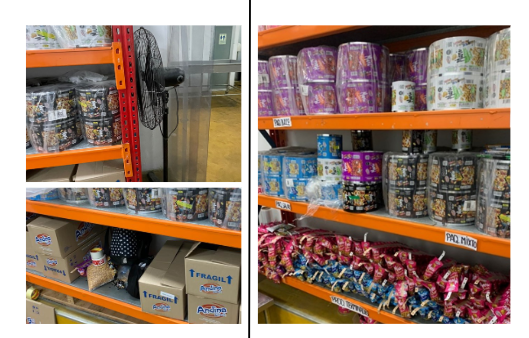
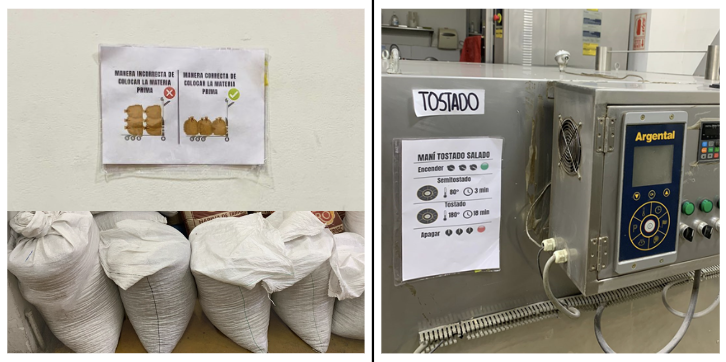
The development of the tool begins with the inspection of each production process in order to identify errors and their respective causes caused by labor or machinery. Then, the appropriate types of Poka Yoke are determined, which are informative focused on detailing specifications and indicating correct use of instruments. As shown in Figure 3, information template 1 shows the correct way to place the 50 kg bags of raw materials, which would be to place them vertically, without the need to stack.
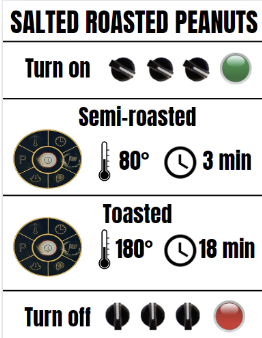
As shown in Figure 4, in the case of information template 2, the temperature and time specifications are detailed according to the chosen production line, in the roasting machine, its design is clear and concise, using specific graphics and texts, so that the information is received by the personnel involved in the process.
3. 2. Sub-headings
The objective of Total Productive Maintenance (TPM) is to generate a system in which all maintenance activities can be planned and not hinder production activities. [9]
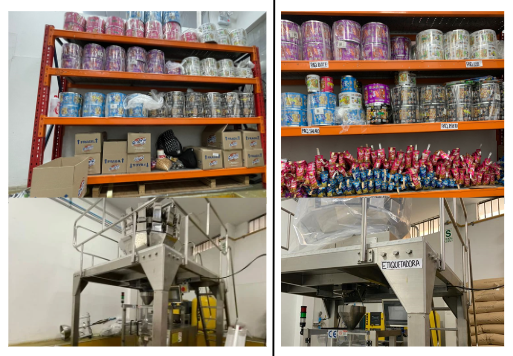
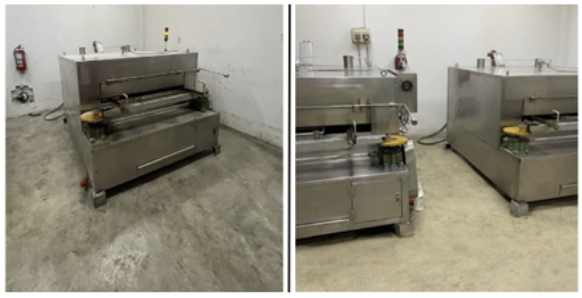
As shown in Figure 5, the development of this tool begins with the identification of the machines, which are the toasting, mixing and labeling machine. Then the causes that generate losses in each piece of equipment are identified and the initial and improved situation is simulated using the Arena software. The quantity to be produced daily was taken as data, which is 100 kg, as well as the downtime of the roasting machine, which is 60 to 80 minutes. The production of salted peanuts occurs 3 times a week.
Next, the sample size will be carried out for the pilot plan for the implementation of the 5s and Poka Yoke tool, in order to obtain optimal results. The sample size formula is presented in Eq. 1 as:
- N = Population size = 8 hours * 5 * 4 * 12 = 1 920 hours
- Z = Statistical parameter = 95% = 1.96
- e = Maximum accepted estimation error = 5%
- p = Probability of the studied event occurring (success)= 50%
- q = (1-p) = Probability that the studied event does not occur = 50%

n = 320.25 hours
Weeks = 1.906 = 2 weeks
According to the calculation, it can be concluded that the pilot test time to evaluate the reliability of the implementation of the tools mentioned above is 2 weeks. On the other hand, samples will be taken after certain processes, for this a container with a capacity of 5 kg was used, which makes it easy to carry out this activity, this would be 5% of the total income in one day, so consider a representative sample.
4. Results
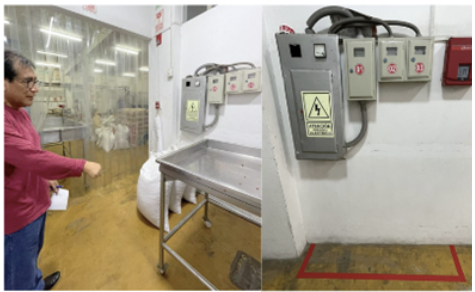
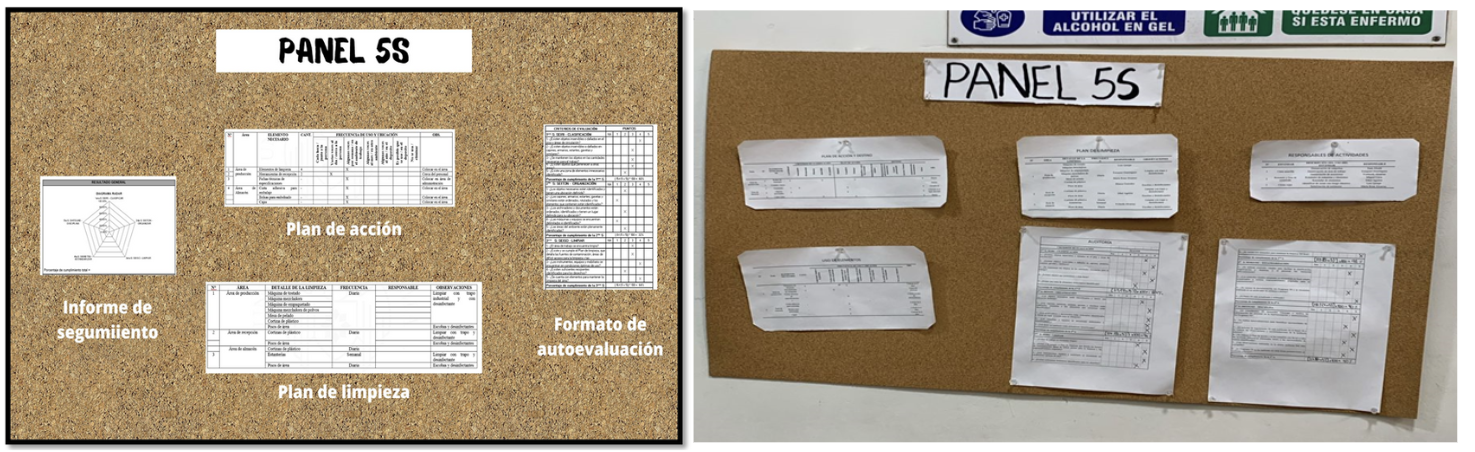
The implementation of the 5S tool consisted of carrying out each S previously proposed in the determined test period, as shown in Figure 6, 7, 8, 9 and 10, photos were taken as evidence of the implementation and improvement obtained, comparing the initial situation and the improved one.
After carrying out the final audit, outstanding results were obtained, reflected in the table. As shown in Table 1, these results reveal a total score of 113, with an indicator of 90.4%. It is evident that a notable improvement was achieved compared to the results obtained in the initial audit. This improvement reflects the continued commitment of staff.
Table 1. Initial audit – Final audit
|
Initial Audit |
Final Audit |
|||
|
5s |
Score |
Indicator |
Score |
Indicator |
|
Seiri |
13 |
52% |
21 |
84% |
|
Seiton |
8 |
32% |
24 |
96% |
|
Seiso |
16 |
64% |
23 |
92% |
|
Seiketsu |
4 |
20% |
18 |
90% |
|
Shitsuke |
6 |
20% |
27 |
90% |
|
Total |
47 |
37.6% |
113 |
90.4% |
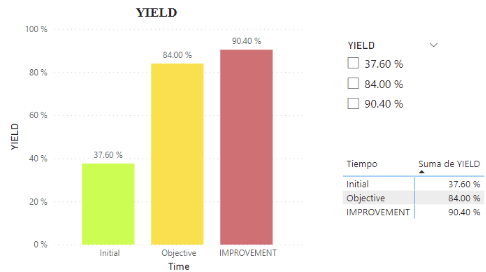
In Figure 11, it can be seen that the initial and target performance had a large difference in improvement. The result of this was that the improvement exceeded the target by approximately 90%, this confirming that the tool was used efficiently.
Regarding the implementation of the Poka Yoke, the previously mentioned detailed procedure will be followed, attaching the established template. In addition, as shown in Figure 12, images will be captured to document the results obtained in the process.
To visualize the changes and improvements from the Poka Yoke tool, data was collected on the losses incurred in the processes where the templates were used during the two-week test period. This was done using a 5 kg sample. It should be noted that the salted peanut production line operates only three times a week.
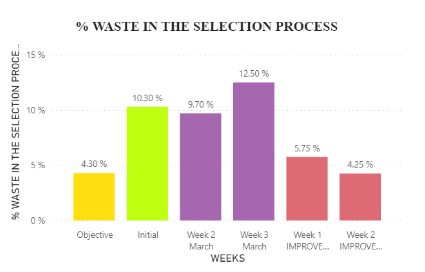
As shown in Figure 13, a lower average waste is evident in the first week, however, it did not exceed the objective, this due to the operators' adaptation process to the new system. In the second week, there was a significant decrease, indicating rapid improvement as staff become familiar with the new system.
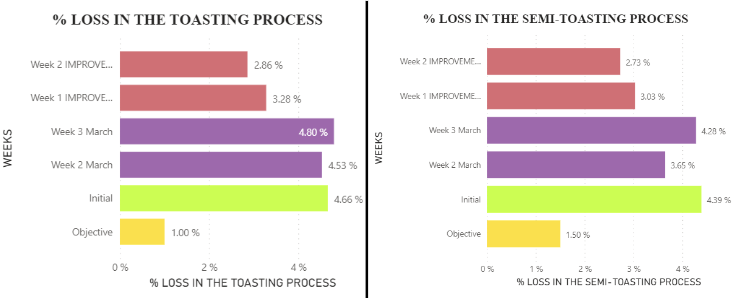
Finally, it is observed that in Poka Yoke type 2 the results did not meet expectations, because these processes require machinery, and machinery failures or stoppages lead to reprocessing and, consequently, waste. In other words, to significantly reduce the waste percentage of these specific processes, both tools need to be implemented simultaneously.
In the case of the TPM simulation, as shown in Figure 15 and 16, the report shows us an improvement regarding the availability of the machinery, therefore, waste is reduced and the production quantity has increased, since previously 14 boxes of salted peanuts were produced daily, and in the improvement model there is an improvement of 15 boxes daily.
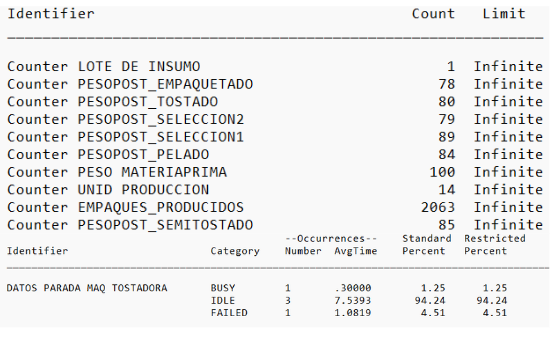
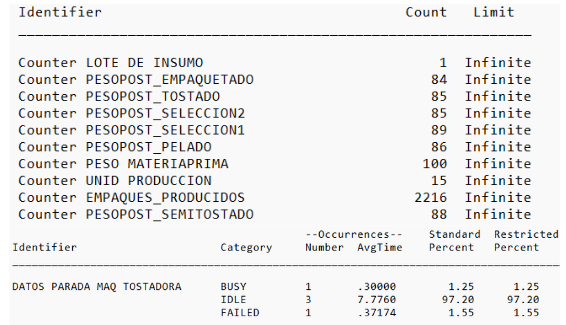
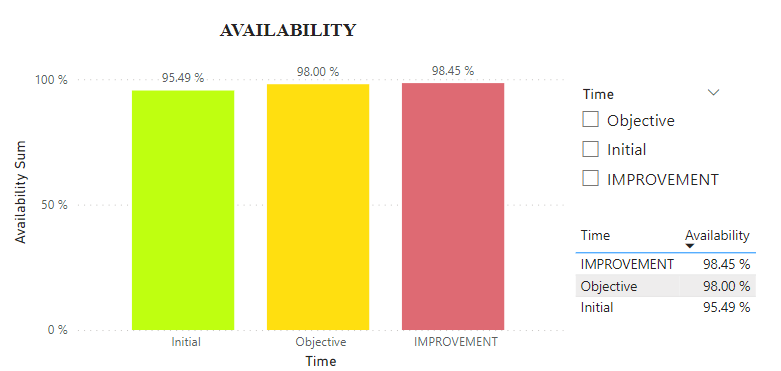
Likewise, we can observe in Figure 17, that in the initial situation the availability of the roaster is 95.49%, and in the improved situation it is 98.45%, which means that the downtime is considerably reduced.
As can be seen in the table 2, to significantly reduce the percentage of waste of these processes, it is required that the TPM and Poka Yoke tools be put into action simultaneously. Therefore, in the simulation, as shown in Table 2, a notable difference can be seen in the losses obtained after each process, since the implementation of poka yoke was taken into account.
Table 2. Comparison of results TPM simulation
|
Machinery |
Process |
As Is |
To Be |
To do |
|
Toaster machine |
Semi-roasted |
4.39% |
1.5% |
1.19% |
|
Toaster machine |
Toasted |
4.66% |
1.0% |
0.94% |
|
Labeling machine |
Labelled |
1.56% |
1.1% |
1.20% |
Regarding economic results, as shown in Table 3, a comparison of the economic evaluation was carried out before and after the implementation of the tools, in order to demonstrate the monetary improvement and how profitable the project is. It was decided to project for 5 months since the investment is not a significantly high amount compared to the monthly profit generated by the company.
Table 3. Comparison of economic evaluation indicators
|
Indicators |
Before implementation |
After implementation |
|
NPV |
$ 1,131.82 |
$ 3,895.82 |
|
IRR |
20% |
58% |
|
Cost-benefit |
1.67 |
3.32 |
|
Payback |
3.25 months |
1.67 months |
In the table above the Net Present Value (NPV) is $3,895.82, which means that if the proposed improvements are implemented, a satisfactory return on investment would be obtained, indicating that the project is viable. In the case of the Internal Rate of Return (IRR), it was found to be 58%, making the project profitable.
The Benefit-Cost ratio indicates that for every dollar invested, the project generates a benefit of $3.32, which is a positive point since it is greater than 1. Finally, the payback period indicates the time needed to recover the capital investment, which is 1.67 months.
5. Discussion
At the beginning of this improvement project, the need to optimize the efficiency of the equipment in the company was identified. The results obtained are in line with previous research, such as those of Cubas Rodriguez et al. [4] show that the implementation of TPM improved the availability of equipment up to 96.67%. Similarly, the findings of Amiel Reátegui et al. [10] indicated a reduction in downtime by 23%, in the study company an increase of 2% was noted with respect to the initial availability, this means that the application of TPM is an effective system of continuous improvement and has proven to be invaluable to our project by achieving favorable results that increased the company's operational efficiency.
Furthermore, the implementation of the 5S methodology achieved that the results of Chávez et al. [11] increased their performance from 59% to 74%. In the case of the study company, the evolution of the audit revealed a significant change, going from 37.6% to 90.4%. which demonstrates the positive impact of this tool in improving the efficiency and quality of processes, which in turn contributes to promoting operational excellence in workers.
Finally, the implementation of Poka Yoke in the study company aligns with the results of Djunaidi and Octaviani [12], which focus on preventing and reducing errors at their source through the use of control sheets, instructions, or templates. In this case, informative templates were placed in the areas where the most errors and losses occurred and positive results were achieved.
6. Conclusion
It is concluded that the 5S methodology has been fundamental to improve order and prevent incorrect handling of raw materials in the work environment. 5S promotes organization, cleanliness, standardization and employee responsibility, reducing errors and improving product quality. Its successful implementation brings important benefits in efficiency and safety in the workplace.
On the other hand, the simultaneous implementation of the Poka Yoke and TPM tools generates a reduction of 1.19% and 0.94% in the semi-roasting and roasting processes respectively, since in these processes there are errors of both personnel and machinery, so They need to be run at the same time to see the greatest improvement.
With respect to economics, a noticeable difference can be seen, since when implementing the tools the units produced increase by approximately one box per day, that is, monthly the difference is 16 boxes since the chosen production line is carried out 3 times per week, which is equivalent to $434.34 more per month, this usually varies depending on the loss.
Finally, the environmental impact has been significantly reduced, as the decrease in solid waste generation has led to less pollution. This is because the improvements implemented have reduced the amount of waste, which is directly related to waste generation. Additionally, preventive maintenance keeps the equipment in optimal condition, avoiding reprocessing and reducing energy consumption. On the other hand, the cleaning plan and staff training have optimized water usage, reducing effluent waste.
References
[1] Donderis, L., Martínez, A., Nagrani, R., Zachrisson, C., & Barría, N. (2019). Aplicación de las tres primeras etapas de la metodología DMAIC para identificar la causa principal de la merma en el proceso de producción de las tortillas de harina de trigo. 5, 48-53. View Article
[2] Ministerio de Agricultura y INTA Universidad de Chile (2018) Manual de pérdidas y desperdicios de alimentos [en línea]. Santiago: Disponible en: https://hdl.handle.net/20.500.14001/33584
[3] Impacto de los desperdicios de alimentos. (2022). Noticias | Diario Oficial El Peruano. https://elperuano.pe/noticia/192993-impacto-de-los-desperdicios-de-alimentos
[4] Cubas Rodríguez, J. C., Arteaga Luna Victoria, A., Berrospi Mendieta, E., Castillo Alva, N., Estrada, M., Rodríguez Castañeda, A., & Soto Lozada, X. (2022). "Implementation of Lean Manufacturing Tools To the Kid'S Footwear Company." Proceedings of the LACCEI International Multi-Conference for Engineering, Education and Technology, 1-9. View Article
[5] Hakim, A. R., & Hellyward, J. (2021). Poka Yoke To Prevent Human Error At Moulding Process of Integrated Circuit Assembly. Sigma Teknika, 4(1), 55-61. https://doi.org/10.33373/sigmateknika.v4i1.3226 View Article
[6] Vargas Crisóstomo, E. L., & Camero Jiménez, J. W. (2021). Aplicación del Lean Manufacturing (5s y Kaizen) para el incremento de la productividad en el área de producción de adhesivos acuosos de una empresa manufacturera. Industrial Data, 24(2), 249-271. https://doi.org/10.15381/idata.v24i2.19485 View Article
[7] Burawat, P. (2019). PRODUCTIVITY IMPROVEMENT OF HIGHWAY ENGINEERING INDUSTRY BY IMPLEMENTATION OF LEAN SIX SIGMA, TPM, ECRS, AND 5S: A CASE STUDY O<>F AAA CO., LTD. Humanities & Social Sciences Reviews, 7(5), 83-92. View Article
[8] Andrada, A. M. (2020). Poka-Yoke: Sistema a prueba del error. Universidad Americana de Europa. https://unade.edu.mx/poka-yoke-el-sistema-a-prueba-de-errores/ View Article
[9] Saxena, M. M. (2022). Total productive maintenance (TPM); as a vital function in manufacturing systems. Journal of Applied Research in Technology & Engineering, 3(1), 19-27. https://doi.org/10.4995/jarte.2022.15934 View Article
[10] Amiel-Reategui, G., Vargas-Tapia, E., & Viacava-Campos, G. (2022). Increase the efficiency of the machine production process in textile companies through a model based on TPM and SMED. Proceedings of the LACCEI International Multi-Conference for Engineering, Education and Technology. https://doi.org/10.18687/LACCEI2022.1.1.752 View Article
[11] Chávez, J., Osorio, F., Altamirano, E., & Raymundo, C. (2019). Modelo esbelto de gestión de producción para la reducción de desperdicios en PYMES del sector alimentos procesados. August, 40-52. https://doi.org/10.1007/978-3-030-20494-5 View Article
[12] Djunaidi, M., & Pahlevi, N. O. (2021). Application of the Poka Yoke Method in the Mix Packing Part Process to Control the Amount of Flow Out. Djunaidi. OPSI. View Article