International Journal of Environmental Pollution and Remediation (IJEPR)
ISSN: 1929-2732

Volume 12 - Year 2024 - Pages 44-51
DOI: 10.11159/ijepr.2024.006
Production Model Based On Lean Manufacturing and Systematic Layout Planing To Reduce Waste in a Company in the Poultry Sector: A Case Study
Mario Sergio Amoretti-Magallanes1, Paola Alejandra Carpio-Montesinos2, Jorge Antonio Corzo-Chavez3
1,2,3Facultad de Ingeniería, Universidad de Lima, Perú
Av. Javier Prado Este 4600, Santiago de Surco, Lima, Perú, 15023
20183570@aloe.ulima.edu.pe1; 20183721@aloe.ulima.edu.pe2; jacorzo@ulima.edu.pe3
Abstract - This work performs data analysis, as well as economic evaluation to validate whether the implementation of the engineering tools to be used is viable. For this purpose, the background, state of the art of the project, analysis and diagnosis of the problem were prepared using different improvement tools, which in this case are: 5's, visual control and Systematic Layout Planning (SLP). In addition, solution proposals were designed and developed for each tool and in this way validate the solution and economic validation; the impacts they may have on the different stakeholders relevant to the company and the sector. Thus, to achieve the results, pilot tests of 5's and visual control were developed. Where when carrying out an initial audit the result was 62% and after carrying out the pilot test there was an improvement that reached 86%; What it reflects is that if the company complies with the tools, there will be greater efficiency in it. Similarly, the use of the Arena simulator for the SLP tool also improved the technical gap approximately from 0,96% to 0,82%; However, the sector indicates that the ideal is 0,5%, but this will be achieved as the company adapts to the new changes. In addition, the environmental impact was reviewed and its importance was reviewed in order to mitigate it and achieve a friendly product. Likewise, by implementing these Lean Manufacturing and SLP tools, the monthly margin percentage increases by 2%, since monthly by reducing internal shrinkage there would be a monthly income of approximately $1 716,82 and if unplanned stops are reduced using visual management, you will have an income of approximately $4 539,86. For all of the above, it was concluded that, if the poultry company implements engineering tools, it will be more profitable, it will achieve cleaner spaces and, above all, collaborators more committed to their work.
Keywords: Poultry, Eggs, SLP, 5´s, Visual Management.
© Copyright 2024 Authors - This is an Open Access article published under the Creative Commons Attribution License terms. Unrestricted use, distribution, and reproduction in any medium are permitted, provided the original work is properly cited.
Date Received: 2023-01-10
Date Revised: 2024-09-23
Date Accepted: 2024-10-04
Date Published: 2024-xx-xx
1. Introduction
The poultry industry, specialized in the marketing of eggs, maintains an important place in the commercial and nutritional field for human beings, since it is known that the egg is a food of high nutritional value, of moderate price and basic in daily meals a day [1]. In order to understand the commercial egg production chain in Peru, experts consider that the stages belonging to the production process of the egg industry must be known, starting with the laying hens; in addition, knowing their health, the quality of the water they ingest and their balanced diet, which is essential for good production [2]. Quality controls are normally carried out visually and manually, where human error is present, and this has as a result, production batches may be defective or more than one inspection point may be needed, which slows down the process to obtain the final packaged product. Due to this, if production is not statistically controlled, personnel cannot be organized correctly, production lines and more efficient traceability are not sought; constant defects and slow processes will always occur in the commercial egg grading plant. In this way, it is necessary to be able to use tools that help reduce errors and efforts of human capital, be able to eliminate ineffective processes, in addition to being able to achieve a better distribution of the effective work area and a correct interrelation between the different work areas plant. Therefore, for each case the set of tools proposed by Lean Manufacturing and SLP will be applied. It is known that the standard indicator of domestic production loss, according to a study that was carried out in the country that is considered the fifth consumer of eggs in Latin America, estimated that the losses are between 0,5% to 5%, this is during the egg collection and selection process. This indicates that special care must be taken in this process; therefore, an operator must be trained correctly [3]. Finally, four main objectives were considered for the project: Prepare the background and state of the art of the project, carry out the analysis and diagnosis of the problem using industrial engineering tools, design and develop solution proposals and validate the solution, evaluate its economic viability.
To calculate the percentage of the technical gap, historical data of the company was used as shown in Eq. (1) - (2) and the technical gap in Eq. (3).


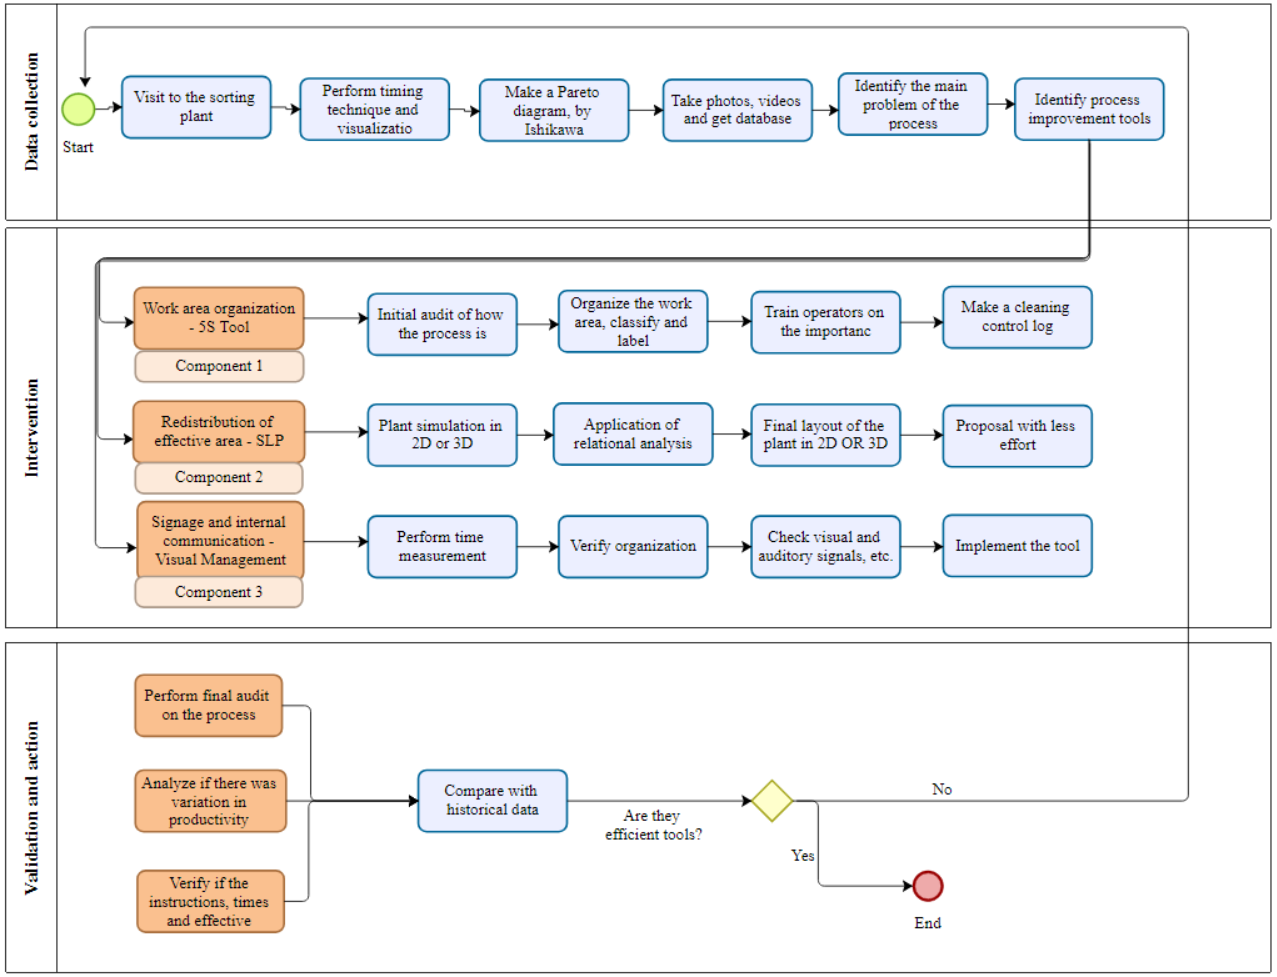
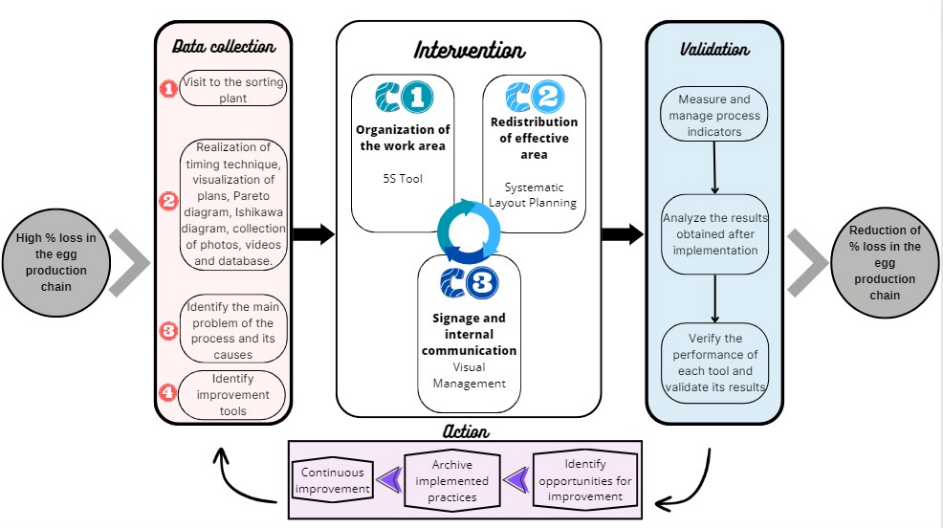
This technical gap indicates when the company has the highest percentage of loss to the date compared to the minimum percentage in the sector. It should be noted that this percentage is from the sector at the Latin America level. Likewise, it means that, if the company reduces its margin of internal shrinkage of commercial eggs, it will achieve greater profit, since they would not have to be sold at a lower cost or in any case be discarded. Finally, Figure 1 shows the implementation process of the solution design.
2. Problem and solution
2.1 Linking root causes to selected solution tools
Figure 2 explains the problems presented during the evaluation of the process and in the same way the proposed solutions of the tools proposed for the reduction of internal losses of a company in the poultry sector, focused on production and marketing, were evaluated of commercial eggs. The points to improve in the production chain and in the work, system was evaluated and diagnosed. In this way, the solutions will be validated taking into account economic viability, cost/benefit, impact on the company's stakeholders and contribution to the company. Firstly, the first two causes are linked: "lack of visual signage that serves as a guide for operators to carry out their tasks correctly" and "lack of periodic counting of days in which maintenance is carried out on the machines", which we will seek to improve using the visual control tool - visual management. Secondly, the causes “Incorrect traceability in the sorting plant” and “Spaces incorrectly used by machines” are linked. For this, the SLP tool was chosen. Which allows resources to be used efficiently, an organization in the different work areas and the equipment to be used. Finally, it optimizes processes and achieves greater competitiveness for the company. Thirdly, the causes "Broken eggs or supplies on the floors or in plant spaces that generate disorder and lack of safety in the process" and "Variable storage spaces for commercial packages which generates an unorganized work environment” which will be worked on using the 5S improvement tool, which aims to achieve a more pleasant and orderly work environment. All this is done in order to promote continuous improvement under standards that allow the operator to better perform their activities. Below is the root cause diagram with its tools.
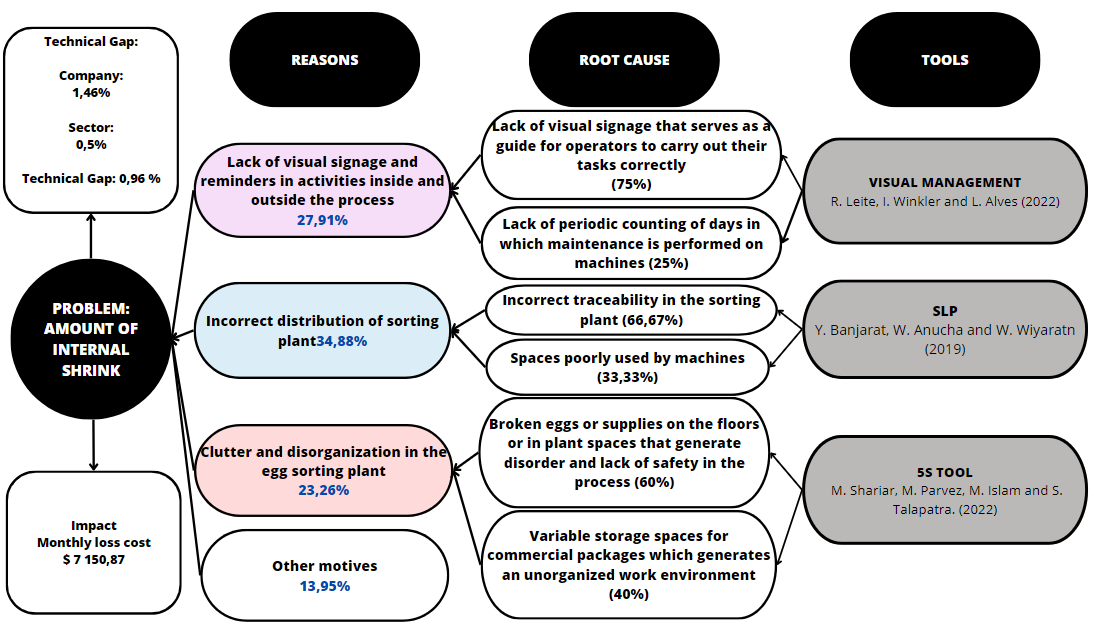
Likewise, in the study company, where a diagnosis was made, various deficiencies were observed. However, it was decided to make a process improvement regarding the percentage of internal shrinkage of commercial eggs. Which indicates that there are various reasons such as lack of visual signage and reminders in activities inside and outside the process, incorrect distribution of the sorting plant; as well as, disorder and disorganization in the egg sorting plant. All of this affects the company's profits, since there is a loss of approximately three thousand USD per year. For these reasons, the construction of an improvement model is proposed that allows us to eliminate the aforementioned causes and thus reduce the inconveniences of the process and be able to optimize the KPI's indicated for the process.
2.2 Macro design of the solution proposal under the state-of-the-art proposal (SLR)
Tools were sought to be used with a scientific article that explains how these proposals will help the company improve, reduce its internal loss, causing greater production and thus achieving greater profitability for the company. These articles, as shown in Table 1, are proposals that were made to companies that had positive results when implemented. Under the review of the reviewed articles, it is known that the poultry sector is important, since its annual production is high and especially when talking about commercial eggs, it is known that it is a product of primary necessity, since its consumption is day to day.
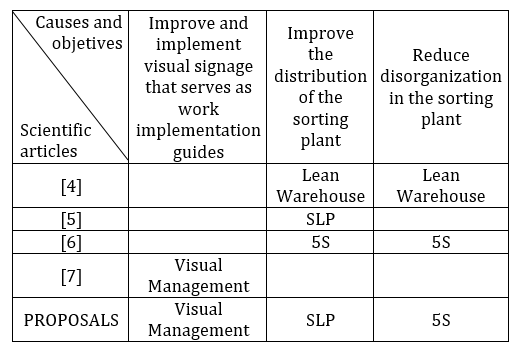
Firstly, the use of the Lean Warehouse model design involves the use of complementary tools such as 5s, SLP and others used such as Value Stream Mapping (VSM). This set of functions allows for progressive improvement of results. This tool is used for adequate warehouse management, to allow an increase in production, a decrease and adequate organization of materials, and a correct use of the space of equipment and machinery [4]. In the company under study, one of the big problems is the inefficiency when sorting defective products, on the other hand, the classification of the inputs or materials used and finally the poor distribution of the effective space of the sorting machine. This generates not only lost or larger scale times, but also lower production and a greater amount of internal and external losses in the process, because if there is not a well-classified process, the consequence is that, by constantly moving the egg, this is easily ends up broken or can end up in the wrong batch.
The application of Visual Management seeks to show transparency of information for workers, improve safety in the plant and outline sequential and repetitive requirements and processes. It helps you find tools and materials more quickly, in addition to serving as a reminder for tasks that must be done at certain times of the day. As a general tool, lights, sounds and other means can be used to serve as an alarm or as a symbol of a specific task or job. In addition, the use of lights and sound is planned in order to be able to warn when the machine needs preventive maintenance due to the time of use. Graphs will be evaluated to know the current loss rate of the process, and compare it with the applied solution [7].
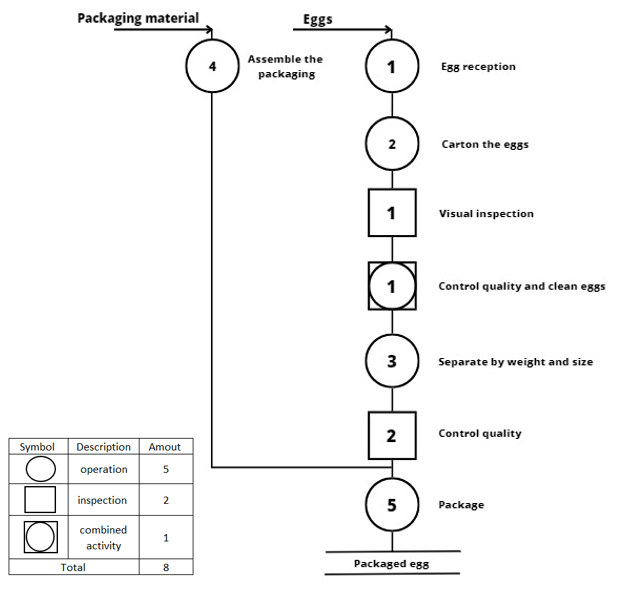
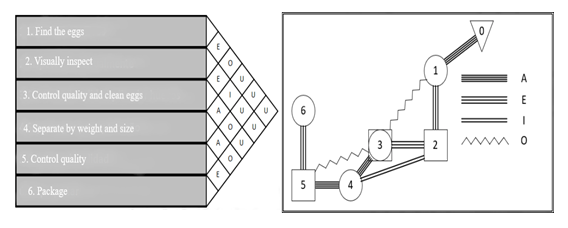
SLP, due to the increase in the production scale of an egg classification plant, recreated the option of being able to build a new plant, but with better managed spaces and taking advantage of the effective work space. Better management, positioning and relocation of machines and spaces with lower production costs, this increases plant capacity and a shorter process time, which generated a change from 90,43% to 94,78%. Likewise, an initial timing by activities is important as an indicator, so that an improvement in times can later be demonstrated. The data is used in order to identify the bottleneck activity, as well as the main activities within the process, it is necessary to recreate a Process Operations Diagram as shown in Figure 2.1 and a Process Operations Diagram. After having identified the different operations, a relational analysis is carried out and then an activity relationship table is carried out. As a final part, it is to be able to use the simulation software of the current layout of the plant [5].
The tool - 5S promotes cleanliness systematically, helps plan, manage and regulate production processes. Likewise, it facilitates the process, saving operational space, capital and time, this produces goods with fewer defects and avoids the creation of waste. This tool is a prerequisite to implement various Lean Manufacturing tools efficiently and motivates human capital, reduces idle time, and eliminates operations that do not add value to achieve a more pleasant work environment [6].
2.2.1 Type and importance of commercial eggs
The cleidoic egg system is characterized by having a thin shell. The cuticle, a differentiated layer on the outer surface of the fibrous cover, is a very important part of the production process, since it is made up of proteins and carbohydrates, which helps in the nutrition of consumers.[8]. Likewise, among all animal products, eggs are the most nutritious, as they are beneficial for human health, especially for pregnant women and babies, and they can be purchased easily. [9].
On the other hand, as the world population grows, egg production has become a very important sector, where there are four types of free-range egg production systems which are: hens in cages, indoor hens, in a field system and in an organic system [10]. Thus, the growth of consumers regarding health and lifestyle has led to an increase in consuming nutrients on a larger scale, which means that better quality is sought in this type of food. This information shows that there must be logistics that can supply consumer demand and achieve good marketing. [11].
2.2.2 Economic and environmental impacts of the egg market
Free-range egg production is high, since its usefulness varies according to the type of production; In the stage of the productive chain there are various production systems, where various profitability is commented as a result from approximately 1.29% to 12.8% [10]. Furthermore, the shepherd type of production is the one with the greatest access, since it integrates poultry management, forage and marketing, which results in good profitability for the company. To determine how profitable this type of production could be, a cash flow was prepared, where the results were favorable, since there was a positive NPV, IRR and the C/B>1 ratio and with recovery of six-year investment [12] it depends on each company.
However, the first impact mentioned refers to the losses caused at the farm level. An example is a South American country, since it is a high producer and consumer of commercial eggs where its percentage of internal loss ranges between 0.5% and 5%. %. In this country, the main use of discarded commercial eggs is for animal feed. However, efforts are being made internationally to develop new options for the alternative use of waste free-range eggs.
The environmental impact must be given importance at a global level. Therefore, it is necessary to examine every detail to guarantee an environmentally friendly product [3].
Likewise, greenhouse gas emissions other than CO2 must be analyzed urgently and mechanisms must be achieved to mitigate them. It is known that the correct management of manure reduces greenhouse gas emissions [13]. For those who do an environmental analysis on egg production and show differences between each system, as is the case of agroecological production, it has less impact. However, greater efficiency is necessary with respect to nitrogen, using disinfectants with less risk for soils [14].
In “environmental impacts of egg production from the perspective of the life cycle” they state that it is a comparison tool. They carried out a life cycle study in the country of the Czech Republic, where the results were that feed conversion, feed composition and manure are factors that affect the environmental impact. [15]. They make a comparison about the impact of pork and poultry production and comment that the feeding for the animals must be special and correct in order to avoid environmental contamination [16].
3. Methodology and implementation
Figure 4 presents the proposed model; it is designed based on the literature review. In other words, the success of the companies where the aforementioned methods were implemented and these have achieved favorable results for the company as mentioned in the solution chapter. For this reason, Lean Manufacturing tools were used, from which Visual Control and 5S and SLP were selected.
The components are:
- Component 1: Organization of the work area – 5'S.
- Component 2: Redistribution of the effective area – SLP.
- Component 3: Signage and internal communication – Visual Management.
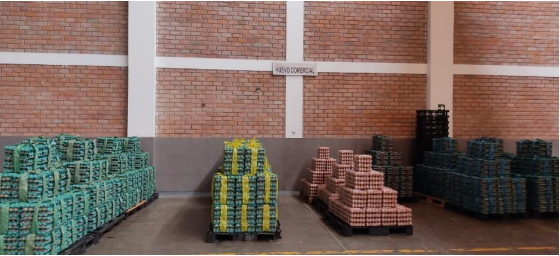
Component 1: Organization of the work area – 5'S. The activities were recorded from the entry of the product to the work area, with photos and videos, in order to be able to evaluate the initial situation. However, before the pilot test, the limitations such as availability and skills of the workers were analyzed, in order to create committees and thus set objectives for each group; in addition, clarifying the purpose of the tool in use to collaborators. Likewise, timing was used to measure the efficiency of 5S implementation and in this way ensure that downtime is evaluated in order to improve in the future. The following requirements must be taken into account, such as: Availability of personnel in the application of the 5S technique, dividing functions and responsibilities, having the focus of the tool phases clarified and knowing how the company is currently doing. The implementation phases are: classification, where unnecessary items must be eliminated to facilitate the workplace. Secondly, this organization, placing the elements in the right place with the help of signs, colors that help better identification. Third, clean, so that dirt does not disrupt the workplace. Fourthly, standardize, here the operator must carry out the activities at a constant pace, here there must be supervision from the plant manager to be able to properly use the tool. Finally, commitment and discipline, this phase is essential, as it implies changes in the behavior and commitment of the team. Figure 3.1 shows how the dispatch part of the commercial eggs is organized.
Component 2: Redistribution of the effective area – SLP. It began with the initial visualization of the plant in order to better understand the process and the spaces used, since this tool optimizes spaces, but if the limitations are not known, the proposal will probably be erroneous. To do this, we begin with the relational analysis as shown in Figure 3.2 (a) to locate each activity appropriately, without forgetting to prioritize activities. In this way, this information was transferred to a space diagram. As a final step in applying the tool, we sought to provide a better distribution or location of the plant as reflected in figure 3.2(b). It must be emphasized that when focusing on activities pertaining to quality, size and weight inspections; the total control time per day has been taken, to have a basis for time reduction and maintain a technical gap.
Component 3: Signage and internal communication – Visual Management. This tool was used with the objective of disseminating production information. This was done through a qualitative field study. This pilot test was done with the plant operators, the avocado manager and the researchers. Where it could be observed that the operators waste time waiting for the cardboard boxes to be able to sort the eggs, looking for any tools they need or wandering around, since they are not aware of the time lost and what this affects the total production. This is done in three stages: Training operators and plant managers, implementation of signaling and standardization and continuous improvement. Finally, the Kanban methodology was applied to develop the tool.
4. Discussion and Results
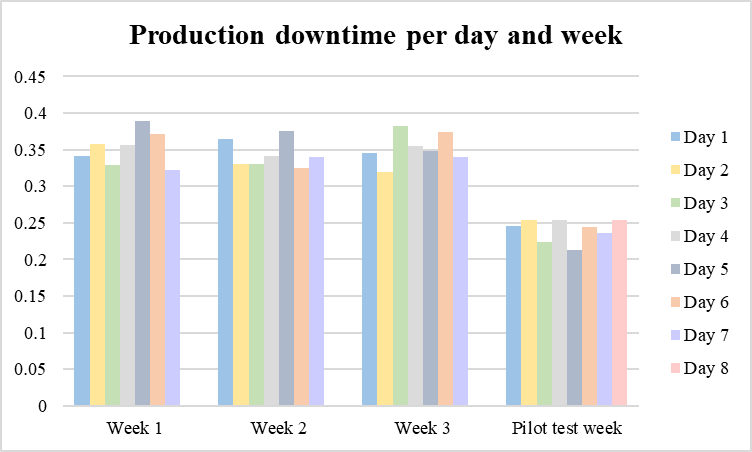
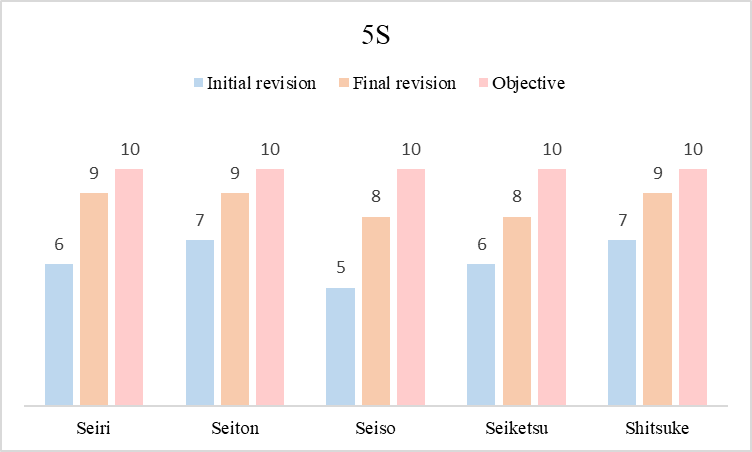
The results were the following, after the evaluation, and solution to the problem of the company in the poultry sector. Figure 4 (a) presents the results of downtime due to time lost due to machine stoppage by day and week. As well as Figure 4 (b) shows the results of the pilot test that was carried out to validate the 5's tool and visual control.
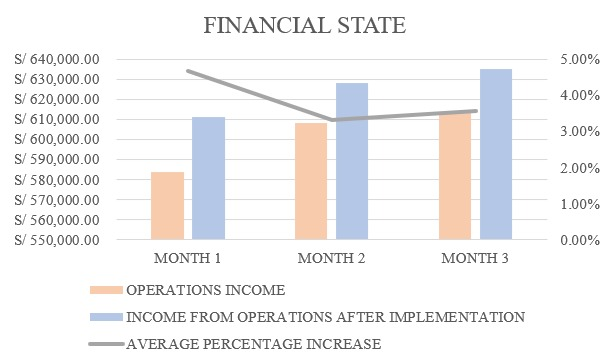
In figure 4.1 the current operating income as well as the operating income after implementation and the line is the gap; meaning what percentage increased.
Similarly, the indicator of the percentage of internal loss of commercial eggs, when using the three improvement tools that are: 5's, visual control and SLP, it is known that if production is 0,96% more in order to achieve a 0,5% internal loss, which is ideal, will result in approximately $1 716,82 more monthly. Similarly, for the indicator of unplanned stops in the production plant, using only the visual control component achieves better effectiveness and this is reflected in a monthly income of $4 539,86 for the company. Finally, the dashboards chosen for the analysis of the study were percentage internal shrinkage, total classification time in hours, time lost due to machinery malfunction, materials located in incorrect spaces and signs found in the work area. An analysis was made by color about how the company should perform with its respective lower limits and upper limits and these are presented in Table 2.
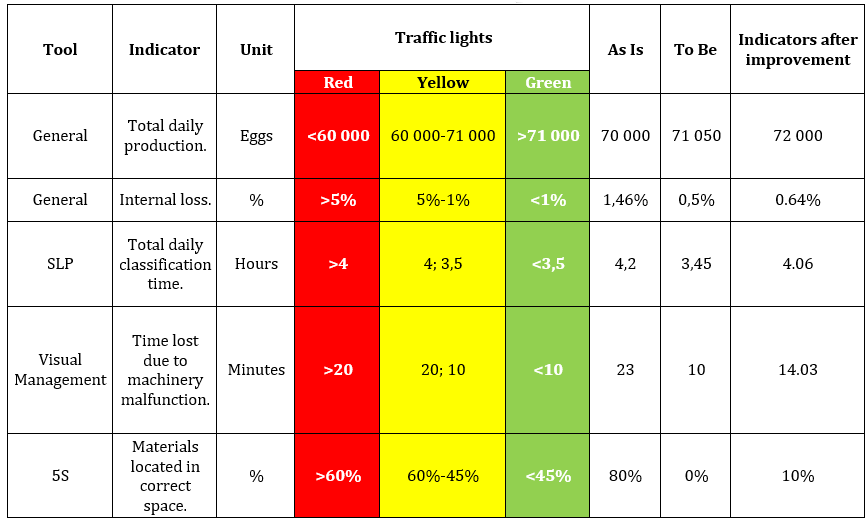
Similarly, table 2 indicates the results obtained from the most relevant indicators of the case study and likewise indicates the efficiency of having applied each tool in the different aspects of improvement evaluated. For this, it is important to differentiate the colors of the traffic lights: red means that the indicator result is below the minimum permissible limit; yellow means that it is within the acceptable values of the indicator and green means optimal compliance with the indicator.
The results of each indicator after having applied the tools are found in the last column of table 2 “Indicators after improvement”, which helped us know if the tools used were adequate to improve the indicator.
Furthermore, it is important to remember that the improvement is not only economic, but there is also an increase in efficiency in production, in production process times and in the order of the work area.
Finally, after carrying out the economic flow of the company, the following results were obtained: its NPV is $58 896,84, IRR is 50%, BCR 5,72 for each dollar invested and Payback is 1 month 15 days.
5. Conclusion
In conclusion, by carrying out the analysis and diagnosis using the 5's engineering tools, visual control and SLP, it helped improve the efficiency of the company, since in the part of order, cleanliness and operator training it improved from 62% to 86% effective and the loss in eggs was reduced approximately from 0,96% to 0,82% of the technical gap. Likewise, when designing and developing the solution to the problem, it is reflected in the monthly margin percentage that increases by 2% and if there are risk scenarios such as optimistic and pessimistic, the company is not affected. In addition, correct use of manure mitigates greenhouse gas emissions, which creates a friendlier environment. Finally, all this was achieved by reviewing the background of the company vs. the state of the art of the project, since it allowed us to better understand the panorama and validate the results of the internal percentage of loss indicator, which the ideal is to achieve 0,5% for the company to be efficient.
6. Acknowledgements
The authors thank the poultry company, which allowed us to have the necessary information to carry out the tests. Likewise, thanks to, Prof. Jorge Antonio Corzo-Chavez for the help provided during the research process and to the University of Lima-Peru.
References
[1] R. Abin, A. Laca, A Laca and M. Diaz, 'Environmental assesment of intensive egg production', Journal of Cleaner Production, vol. 179, pp. 160-168, April 2018, doi: 10.1016/j.jclepro.2018.01.067. View Article
[2] I.Boleli, V. Morita, J. Matos, M. Thimotheo and V. Almeida, 'Poultry egg incubation: Integrating and optimizing production efficiency', Brazilian Journal of Poultry Science, no. 2, pp. 001-016, Oct - Dec 2016, doi 10.1590/1806-9061-2016-0292. View Article
[3] J. Cabello, V. Villanueva, F. Valdes and C. Valenzuela, 'Waste eggs in Chilean: Estimation of production chain losses and possible uses' Chilean nutrition magazine, vol 49, no. 1,2022, doi: 10.4067/S0717-75182022000100017. View Article
[4] E. Ramos, A. Paulino, P. Chavez, J. Alvarez and S. Nallusamy, 'Pilot Implementation of Innovative Proposal for Service Level Improvement in a Spare Parts Trading Company', Scientific. Net, vol. 62, pp. 173-187, November 2022 doi: 10.4028/p-70sd0q. View Article
[5] Y. Banjarat, W. Anucha and W. Wiyaratn, 'Plant Layout Desing for Improvement and Eggs Grading Process', ACM Digital Library, pp. 19-25, May 2019 doi: 10.1145/3335550.3335572 View Article
[6] M. Shariar, M. Parvez, M. Islam and S. Talapatra, 'Implementation of 5S in a plastic bag manufacturing industry: A case study', Cleaner Engineering and Technology, vol. 8, Jun. 2022, doi: 10.1016/j.clet.2022.100488. View Article
[7] R. Leite, I. Winkler and L. Alves, 'Visual Management and Gamification: An Innovation for Disseminating Information about Production to Construction Professionals, Applied Sciences, vol. 12, no. 11, June 2022, doi: 10.3390/app12115682. View Article
[8] G. Kulshreshtha, L. D'Alba, I. Dunn, S. Rehault, A. Rodriguez, M. Hincke, 'Properties, genetics and innate immune function of the cuticle in egg-laying species', Frontiers in Immunology, vol 11, Feb 2022, doi.org/10.3389/fimmu.2022.838525. View Article
[9] N. Yang, 'Egg production in China: Current status and outlook', Frontiers of Agricultural Science and Engineering, vol 8, 2021, doi: 10.15302/J-FASE-2020363 View Article
[10] A. Crnčan, L. Hadelan, I. Kralik, D. Kranjac, S. Jelić, J. Kristić, 'Break-even analysis of poultry egg production in Croatia' European Poultry Science (EPS), 2018 doi:10.1399/eps.2018.230. View Article
[11] B. Ruiz, R. Rocha, M. Nogueria, 'Quality Control of Protein Supplements: A Review', Human Kinetics Journals, vol. 31, n. 4, pag. 369-379, 2021, doi.org/10.1123/ijsnem.2020-0287 View Article
[12] A. Cruz Bermúdez, R. WingChing Jones, R. Zamora 'Egg Production Feasibility in laying hen with Access to Grazing', Mesoamerican Agronomy, vol 32, May 2021. doi.org/10.15517/am.v32i2.39673 View Article
[13] C. Xiong, W. Su, H. Li, Z. Guo, 'Influencing mechanism of non-CO2 greenhouse gas emissions and mitigation strategies of livestock sector in developed regions of eastern China: a case study of Jiangsu province'. Environmental Science and Pollution Research, vol 29, Feb 2022, doi.org/10.1007/s11356-022-18937-1 View Article
[14] K. González, D., A. Landázury, A. Chaparro, 'Evaluation of environmental impacts in the agroecological egg production chain with a life cycle approach', Journal of Environmental Sciences, vol 54, n.2, pp. 165-179, Jul 2022 dx.doi.org/10.15359/rca.54-2.9 View Article
[15] A. Guillaume, A. Hubatová., V. Kočí, 'Environmental impacts of egg production from a life cycle perspective'. Agriculture, vol 12, Mar 2022, doi.org/10.3390/agriculture12030355 View Article
[16] I. Andretta, F. Hickmann, A. Remus, C. Franceschi, A. Mariani, C. Orso, M. Kipper, M. Létourneau, C. Pomar, 'Environmental impacts of pig and poultry production: Insights from a systematic review', Frontiers in Veterinary, vol 8, Oct 2021, doi.org/10.3389/fvets.2021.750733 View Article