International Journal of Environmental Pollution and Remediation (IJEPR)
ISSN: 1929-2732

Volume 12 - Year 2024 - Pages 42-49
DOI: 10.11159/ijepr.2024.005
Improvement Model to Reduce Stock-Outs Using Economic Order Quantity, Material Requirements Planning and ABC Classification tools In a Commercial Company Specializing in Solar Thermals: A Case Study
Samantha Isabel Aspajo-Diaz1, Martha Yocklen Mendoza-Moscoso2, Jorge Antonio Corzo-Chavez3
Facultad de Ingeniería, Universidad de Lima, Perú
Av. Javier Prado Este 4600, Santiago de Surco, Lima, Perú
120190170@aloe.ulima.edu.pe; 220191268@aloe.ulima.edu.pe; 3jacorzo@ulima.edu.pe
Abstract - The objective of the research work is to reduce the stock of a company in San Martín, Peru, that offers the installation service of solar thermal heaters. First, a brief description is presented, the background of the organization and an evaluation of the company's indicators to find the problem under study. With this we find the technical gap of 31.11% during the year 2022, which was calculated with the difference of 47.78% of stock outage cases of the company studied compared to 16.67% of a trading Mype found within the analysis of 40 articles scientists. Subsequently, the design of the solution is proposed linking the root causes with the ABC Classification, Material Requirements Planning and Economic Order Quantity. The latter were analysed and the positive contribution to the solution of the problem was concluded. Subsequently, the development of the proposal is known in detail, developing the validation methodologies to verify that the proposed tools are effective for the improvement project through the training of workers, the reorganization of the warehouse and its subsequent verification, where results were obtained. such as the increase of 12.69% in the capacity used in the warehouse, the decrease of 68.75% in cases of stockouts, during the first month of implementation, which implies the reduction of costs and, finally, the reduction in the average assembly time of an accessory kit from 72 to 33 minutes. Finally, a financial analysis is carried out that involves the evaluation of economic flows before and after implementation with a budget of $982.35 to examine the financial viability of the company. With the aforementioned budget, economic results were obtained such as a NPV of $6972.95, an IRR of 187% and finally a B/C of 7.86. Furthermore, it is concluded that the amount invested will be recovered in 0.585 years.
Keywords: Solar Thermals, Stock Break, MRP, EOQ, ABC Classification
© Copyright 2024 Authors - This is an Open Access article published under the Creative Commons Attribution License terms. Unrestricted use, distribution, and reproduction in any medium are permitted, provided the original work is properly cited.
Date Received: 2023-01-09
Date Revised: 2024-09-26
Date Accepted: 2024-10-01
Date Published: 2024-xx-xx
1. Introduction
The company chosen for the present project is an Micro and small business (MSE) founded in the city of Moyobamba, San Martin region that began its consulting and sales activities in 2018. Currently, its vision is to provide quality services and products with punctuality, security, guarantee and honesty with qualified and trained personnel. It is engaged in the import, sale and wholesale and retail installation of technologies based on renewable energy, which has become extremely widespread, because its expansion ensures energy security, cost reduction in production and diversification of energy consumption [1]. Incorporating solar water heaters has a significant environmental impact. By utilizing solar energy, these systems reduce the reliance on fossil fuels and lower greenhouse gas emissions, contributing to a more sustainable planet. Solar water heaters are considered a key solution for cutting down carbon footprints, with even small systems preventing tons of CO2 emissions annually. For instance, a typical system can save approximately 1.5 tons of CO2 per year, while also reducing energy consumption and costs [2] The solar boiler, which consists of a thermal tank and a certain number of vacuum tubes according to the capacity, these tubes are made of two layers of glass with high strength and firmness that allows absorbing the sun's rays and use them in the best way to heat the water that enters. In addition, the company provides the installation service of the aforementioned product. In order to carry it out, a certain number of accessories and materials are needed to assemble the structure of the water heater, fix it in the required space and implement all the piping and connections for a correct operation. Proper installation is crucial to maximizing these benefits. A well-installed system ensures efficient energy transfer, minimizes heat loss, and prolongs the lifespan of the equipment. This translates into both environmental and economic gains, as poorly installed systems may result in energy inefficiencies and increased maintenance [3] Therefore, expert installation and regular maintenance are vital to harnessing the full potential of solar water heaters for environmental and cost-saving benefits.
Commercial MSE have large economic losses due to stock breakage and inadequate stock management, which means an insufficient level of inventories within the service where it results in stock shortages, causing delays in deliveries and customer dissatisfaction [4]. This is due to the use of inefficient supply methods, disorder in the warehouses and the lack of standardization of internal warehouse processes. That is, they do not have a system that seeks to simulate the impacts of stock-outs of different nature. Therefore, it is sought to implement different tools such as ABC Classification, Material Requirements Planning (MRP) and Economic Order Quantity (EOQ) to fulfill the objectives of elaborating the background and state of the art of the improvement project for the solar thermal commercialization company by analyzing the root causes, in addition to analyzing and diagnosing the problem of stockout for inventory management control, designing and developing proposed solutions for stockout and finally, validating the solution, evaluating its economic viability and its impact on relevant stakeholders.
The data provided by the bread commercialization company related to poor inventory management, which led them to implement an MRP system where an analysis of the bakery's inventories was carried out, as well as an evaluation of the tools for improving inventory management [5]. Thanks to this they obtained the necessary quantities of each input to be used for the month of November and December 2021, to meet the tastes and requirements of customers and improve costs, for example, they were able to reduce inventory costs because $ 3487.37 was the cost in December 2020 without MRP and with the application of the methodology was obtained as a result $ 120.55.
The companies that had an excessive amount of inventory that did not convert into completed goods had lost $1.2 billion. As a result, the ABC inventory classification system may cause lower-demanding commodities to become overstocked. By focusing on inventory replenishment, supply chain managers may quickly create day coverage strategies for each category once numerous items have been divided into ABC categories. Inventory can be measured in terms of shifts, days of coverage, delivery times, service levels, and even stockouts in addition to volume and value. It is estimated that approximately 1.3 billion tons of inventory are lost or wasted annually; the study helps to lower this statistic so that the precise amount to use is known [6].
An external organization uses EOQ calculation based on safety inventory and carrying cost calculation to be able to determine the optimal amount of inventory by maximizing the quantity products available without the need to manufacture new ones [7]. Also, article is evident to us that 31% of inventory costs were saved by using the EOQ method, being beneficial to avoid high costs in this area of the company [8].
After a detailed analysis, several key performance indicators (KPIs) were identified in the company studied. Stock out is significant, representing 47.78% in the organization, mainly due to cases of stock outs in 86 facilities per year. The cost of customer acquisition is $21.40, and the percentage of warehouse occupancy is 64.29%. In addition, the percentage of after-sales incidents is 10%.
It is concluded that the company faces a major problem of stock breakage during assembly, which results in operators not finding necessary accessories and having to go out to buy them, generating delays and additional costs. Lack of control over incoming and outgoing goods, disorganized warehouses, and delays in service contribute to stock-outs. These stock-outs cause delays, inconvenience to customers, and additional costs of $3704.95, including increased costs of purchasing accessories immediately, extra mobility expenses, and additional costs due to delays in installation in different cities. It highlights the need to address the technical gap using industry and company information to improve efficiency and avoid losses.
2. Methodology
An exhaustive review of the literature on the reduction of stockout in the company was carried out, using the PRISMA methodology to establish guidelines for incorporating new concepts extracted from scientific studies. A quantitative approach based on numerical data was adopted to collect and analyze information, allowing the researcher to make inferences, formulate hypotheses and extend conclusions [9]. This approach seeks to identify the causes of the situation and address the research question: "What is known about the EOQ, MRP and ABC classification systems to reduce shortages in companies in the renewable energy installation trade sector in the period 2020-2023?" in order to have a proper installation helps to maximize energy efficiency, leading to a reduction in the consumption of conventional energy sources such as fossil fuels, which contributes to reducing greenhouse gas emissions. In addition, a well-installed system ensures the longevity and reliability of the heater, minimizing maintenance needs and preventing possible failures. [10]
With the above, the importance of addressing the problems of delay in service and lack of accessories is highlighted through the implementation of the economic order quantity (EOQ), in which emphasis is placed on the need to efficiently manage inventories, calculating the optimal quantity to order and choosing the right moment to avoid excesses or shortages in warehouses. Therefore, it is suggested to apply the EOQ tool for each material, establishing key terms and calculating the optimal quantity to improve accessories management:
Where:
- S: Cost of ordering an order
- D: Annual product or raw material demand
- H: Storage cost of each unit
- Q: Optimum quantity of units to order in each order
Second, commercial companies face challenges in materials management and turn to materials requirements planning (MRP) to determine the number of kits needed. In the case studied, shortage problems were detected in the installation of solar water heaters due to an inadequate projection of the quantities to be purchased. Then, it is necessary to use the Gozinto diagram to identify the necessary accessories, dividing them into two parts: the connection of the water tank to the solar water heater and the connection of the solar water heater to the shower. In addition, the projection of accessories for the next 6 months according to the services of the previous year, verifying the current inventory to cover demand, without safety stock and with a delivery time of 1 month. As a result, the organization should order the estimated number of accessories to meet the demand.
The ABC method aims to organize and prioritize the materials necessary to install solar thermal systems in warehouses, ensuring that the most expensive products are considered of greatest importance. According to this tool, it classifies items by controlling inventory according to average cost, annual consumption value and delivery time, thus addressing the common problems of more than 60% of companies in inventory control and classification [11].
3. Implementation and Results
For this improvement project, a timeframe of 6 months was considered to implement the proposal in the selected company during the year 2023. This schedule began with the identification of the proposal during the month of April, the elaboration of the diagnosis during the month of May, the preparation of the theoretical framework during the month of June, the design of the solution proposal during the months of July and August, and finally, all the development of the implementation that took place during the month of September.
Likewise, for the correct operation of the project, the organization has the important task of observing and complying with Peruvian laws and regulations issued by the country's public entities, taking into account international agreements and standards. In principle, the Peru-China Free Trade Agreement was considered, which makes it possible to strengthen trade relations with a nation whose market is the largest in the world. This agreement offers the opportunity to gain more favorable access to a market characterized by a growing demand for consumer goods, raw materials, intermediate goods and capital goods [12]. In the second place, the Chief Resolution No. 335-90-INAP-DNA will be of utmost importance to establish an efficient supply system, guaranteeing an adequate management of the warehouses and a timely supply process for the State entities. The main objective will be to conserve material resources and ensure high quality standards. Thirdly, ISO/IEC 13273-2, which allows the application to energy efficiency and renewable energy sources. Fourth is NTP 399.404:2006, which deals with the fundamentals for efficient sizing of solar water heating systems [13]. In fifth place, the NTP 399.482 2007 that shows the procedure and requirements linked to the quality of materials for the efficient installation of solar water heating systems [14]. Finally, the ISO 45001 that give to know the occupational health and safety management systems to know how to control the risks associated with storage operations and handling of goods [15]
After implementing all the chosen tools, the results obtained were validated. First of all, we calculate the quantity that should be in the warehouse to meet demand and fulfill services on time and without shortages. To do this, using the MRP tool, with the use of a procedure’s manual (figure 1) and training investing a total of $155, the owner of the company recorded the number of installations of the last 6 months to know the number exact number of accessories needed in the warehouse, obtaining a total of 2813, which was verified through an account. At the time of organizing the new warehouse, this was greater than the amount they handled for 6 months in 2022 of 2,349, which justified the lack of materials when putting together a kit. With the above, it is observed that the use of the warehouse occupies almost 80%, helping to reduce the main problem of the problem and giving a more efficient use of space.
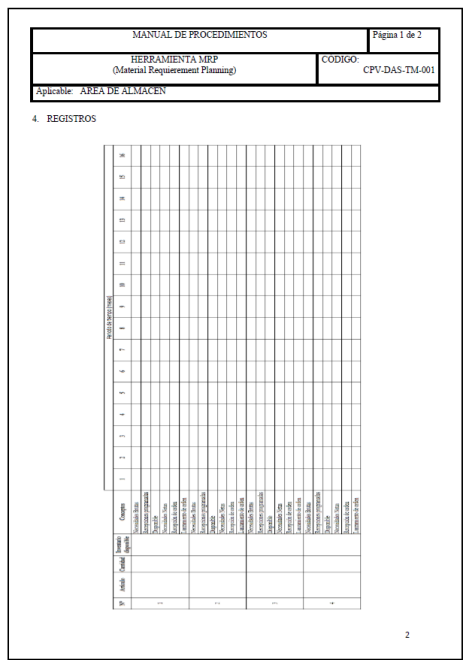
Table 1: Comparison of warehouse utilization
|
|
AS-IS |
REAL |
|
Capacity Used |
2349 |
2813 |
|
Warehouse utilization |
64.29% |
76.98% |
For the second validation methodology, we will take into account the number of services served in the month of September 2023, which was a total of 16, of which in only 2 cases there was a shortage at the time of installation because in these cases If the materials and accessories had factory defects or the operator caused damage when handling them, for example, when there is a defect in a Teflon tape for hot water, it is purchased on the spot, at a cost of $2.14 compared to what the supplier offers, which is $1.34. With the above, it can be concluded that cases of stock outages due to problems such as lack of materials in the warehouse or poorly assembled installation kits decreased significantly. For this, virtual training was carried out, complemented with instructions, as shown in Figure 2 which focused on key concepts of the model, associated costs and the practical resolution of a real case with a cost of $155.
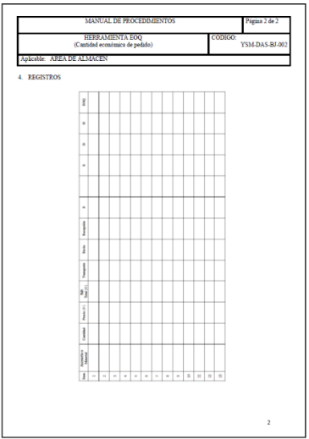
Table 2: Comparison of stock breakage cases during the month of September 2022 and 2023
|
|
AS-IS |
REAL |
|
No. of Stock Breaks |
13 |
2 |
|
Additional cost involved |
$ 433.72 |
$ 66.73 |
For the ABC method, the third manual training was carried out at a cost of $155, highlighting the importance of ABC classification to correct disorganization in the warehouse, which causes delays in the selection of materials. The warehouse was divided into three zones (C, B and A) according to unit costs, facilitating effective classification. Consequently, the warehouse was divided into three zones according to the unit costs of each, which range from $0.27 to $9.35. With the previous information, the warehouse was divided into 3 groups for a correct classification, which will be from 0.27 to 2.41 dollars for zone C, from 2.67 to 5.34 dollars for zone B and finally from 5.61 to 10.69 dollars for zone A. This new organization will allow the highest cost items to be prioritized, streamlining the assembly of installation kits and reducing incidents by 50% thanks to greater knowledge by staff of the location of each item. It is also expected to ensure the necessary quantities and avoid delays. The new warehouse required new shelves, trays, markers, etc., which meant an investment of $7,233.43. Below you will see the before and after of the accessories warehouse (Figure 3 below).
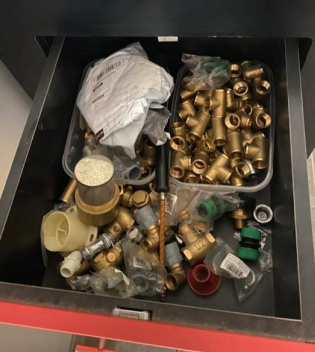
(a)
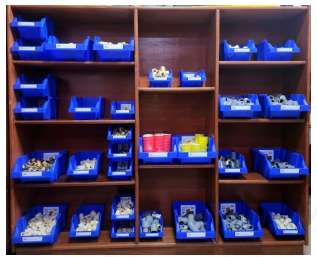
(b)
That is, the problem arose where the workers in charge of the installation took more than an hour to assemble a kit before providing the service, this generated delays and the possibility that the kits could not be completed properly due to no stock available in the deposit. Therefore, after the reorganization of the warehouse, the assembly time required by each operator was recalculated, where it was calculated that the appropriate sample size is 12 installation services. After taking the time, it was found that each operator currently takes between 28 to 38 minutes, resulting in a significant decrease when using the new warehouse implemented.
Table 3: Comparison of the average assembly time of 1 installation kit
|
|
AS-IS |
REAL |
|
Average time of Operator 1 |
60 minutes |
28 minutes |
|
Average time of Operator 2 |
70 minutes |
38 minutes |
|
|
65 minutes |
33 minutes |
Fourth, there were cases in which the company incurred extra expenses for staying more than one day in another city for the installation of one or more hot springs, this cost amounted to US$69.61. This problem could be caused, on the one hand, by a lack of accessories in the warehouse or poor planning of the necessary installation kits, causing delays and extending the time in which the service was provided. On the other hand, a cause of this problem could also be produced by weather changes, but these are less frequent. With this validation it was demonstrated that since the implementation of the new warehouse only 1 case was generated in September due to heavy rains, but on no occasion was it caused by lack of materials or accessories, which indicates that with the improvement these cases can be minimized or avoided, since the records of the year 2022 identified 3 cases in total, where 2 were due to lack of accessories and 1 due to weather conditions.
Table 4: Comparison of cases of stock-outs and extra expenses presented at facilities in other cities
|
|
AS-IS |
REAL |
|
Total cases of installation in other cities |
3 |
3 |
|
Cases of delay due to weather problems |
1 |
1 |
|
Cases of stock out of stock |
2 |
0 |
|
Total extra costs |
$ 208.52 |
$ 69.51 |
Finally, after obtaining the results, the economic flow before and after implementing the improvement in the company studied was carried out. For the first flow we considered the company's recorded data from January to August 2023 and for the second flow we collected data from September and October, and a projection was made from November to April 2024. In addition, an investment of US$981.92 was added to carry out the implementation of the improvement, which involves the costs used for the redesign of the warehouse and the ABC, MRP and EOQ classification tools.
Table 5: Comparison of economic flows before and after the upgrade
|
|
Before |
After |
Variation |
|
0 |
0 |
$ 981.92 |
|
|
1 |
$1376.52 |
$1926.2 |
$549.68 |
|
2 |
$1486.75 |
$1486.75 |
$258.74 |
|
3 |
$1694.76 |
$1494.13 |
-$200.63 |
|
4 |
$1875.56 |
$1561.00 |
-$314.76 |
|
5 |
$1513.38 |
$1128.41 |
-$384.97 |
|
6 |
$1513.38 |
$1835.18 |
$321.8 |
|
7 |
$1034.36 |
$1925.52 |
$891.16 |
|
8 |
$1623.57 |
$2153.29 |
$529.72 |
4. Discussion
By conducting a thorough review of the organization, identifying its limitations, indicators and existing challenges, it is concluded that there are opportunities for improvement. This is due to the presence of manual processes and lack of standardization, factors that cause delays in work operations. In other words, the lack of standardization and reliance on manual processes not only results in delays in operational efficiency, but also increases the likelihood of human error. This can have a negative impact on product or service quality, customer satisfaction and, ultimately, the company's competitiveness in the marketplace. However, through the application of engineering tools, it is possible to address and improve existing problems. This is because these tools not only allow processes to be automated and standardized, reducing execution times and minimizing errors, but also offer the opportunity to take advantage of advanced technologies to further optimize efficiency and quality. It is crucial to consider the importance of evaluating various aspects of the environment to ensure efficiency and prevent possible future damage. This involves considering not only the internal aspects of the company, but also market trends, competition and regulations. This ensures that the company is aligned with the changing demands of the business environment and is able to maintain its position in a constantly evolving market. In this respect, it is essential to analyze the forty scientific articles with which we conclude that the use of the three tools is a good option to solve the same problem and more precise results are obtained compared to the cases presented in the state of the art where one or maximum two tools are used.
It was important to make a comparison of the disparity in stock failures of the same company between the years 2022 and 2023, in relation to the percentage of cases of a micro and small company (mype) dedicated to commercialization. During the year 2022, a disparity of 31.11% was evident, calculated by the difference between the 47.78% of cases of stock breakage in the company under study and the 16.67% of an entity mentioned in a scientific article. This entity sought to implement an operational tool to help companies efficiently organize their warehouses, with the objective of improving the level of service due to losses in sales and clientele [16]. However, in the year 2023, a significant decrease was recorded, with a gap of 15.99%. This was based on the consideration of 65 cases of stock breakage out of a total of 199 cases, representing 32.66%. It is worth noting that this calculation took into account that implementation began in September, reflecting improvements in the project from that time onwards.
By employing the three improvement strategies, namely MRP, EOQ and ABC Classification, their high effectiveness in decreasing the company's inventory shortage was evidenced. The MRP tool played a crucial role in accurately determining the capacity required to meet all the demands of the solar thermal installations, achieving a significant increase of 76.98% from the previous level of 64.29%. As for the second tool, the EOQ, it not only helped to identify and reduce the incidence of stock-outs in September, decreasing it from 81,25% to 12,5%, but also proved essential in calculating the additional costs associated with that month, generating an increase of only $66.70 compared to the previous $433.72. Finally, the ABC Classification stood out as the most relevant strategy to address the problem under study. This tactic allowed for an efficient reorganization of the materials warehouse, simplifying the location of accessories needed to assemble an installation kit. The time required to locate each of these elements was evaluated, achieving a reduction of almost 50% in search times, thus improving the efficiency of the workers.
Concluding the economic impact analysis, the feasibility of implementing the improvement tools in the company has been ratified. The amount of investment is affordable for the company, and it is anticipated that it will be recovered in less than one year. In addition, this investment promises to generate improved profitability compared to the alternative of not implementing the improvement, since higher revenues are projected in the first eight months, with an increase of $1650.94 with respect to the economic flow prior to implementation. This increase will help amortize the $981.54 investment in less than a year. Beyond economic gains, this investment also contributes to environmental sustainability. By optimizing resources and energy consumption, the company not only reduces operational costs but also lowers its carbon footprint, aligning with global efforts to mitigate climate change and promote sustainable business practices
5. Conclusion
This paper concludes that the development of the state of the art is important to understand the challenges and opportunities faced by the company to improve its efficiency and increase its profitability. In addition, integrating solar thermal systems presents a significant opportunity to reduce operational costs and environmental impact. The adoption of these sustainable technologies not only contributes to energy savings but also aligns the company with global environmental goals, enhancing its corporate social responsibility and fostering a positive public image. To this end, it was essential to identify the causes that produced the stockout to understand the situation of the company at the time of providing the solar thermal installation service. In addition, the analysis of the background allowed us to identify the best strategies to implement in the improvement and make the most appropriate decisions. Also, the analysis and diagnosis made on the stock breakage through the use of industrial engineering tools provided us with an important basis for making decisions based on real data, so that we identified the causes of the problem and with it we could identify the best tools to reduce the number of cases, which was achieved for the month of September 2023 to reduce 8 cases compared to 2022.
After classifying the different scientific articles included in the research work, it was concluded that one of the tools to mitigate the problem is EOQ, since it allowed optimizing inventory management and addressing the problems related to the availability of accessories and materials at the time of providing the service. By calculating the optimal order quantity, it was possible to minimize total costs and maintain inventory costs by spending $66.73 in the month of September 2023 alone, as opposed to the $439.07 spent in 2022. Likewise, the amount of inventory needed by the company to meet demand is reduced and stock-outs are minimized. Another of the tools implemented in the improvement project is MRP, since it focuses on the planning and supply of accessories. During the implementation, it was possible to obtain an accurate planning and adequate control of the warehouse supply, finding an adequate capacity of 76.98% to meet the needs. The ABC classification was the last tool that was used, which allowed us to distinguish and separate each of the accessories and materials according to their prices and thus be able to reorganize the area established for storage. This tool allowed us to reduce the time required to assemble the installation kits, which previously took an average of 2 workers 72 minutes, but with the tool this time was reduced to 33 minutes.
Finally, after performing the analysis and economic flow, it is concluded that the implementation of the improvement proved to be a viable decision for the company and, in addition, the investment made for it can be recovered within a month of implementation, being profitable for the organization of San Martin, Peru.
References
[1] Heshmati,A. , Khezro,M. &Khodaei,M.(2021). The role of R&D in the effectiveness of renewable energy determinants: A spatial econometric analysis. 99. Fusil, D Nava, N & Ochoa, R (2020). Comprensión epistemológica del tesista sobre investigaciones cuantitativas, cualitativas y mixtas. Orbis: revista de Ciencias Humanas, 13-22. View Article
[2] Geesol Energy. (2024). Solar water heaters. Geesol Energy. View Article
[3] Fenice Energy. (2024). How solar water heaters work: Design, components, and benefits. Fenice Energy Blog. View Article
[4] Del Carpio, C., Llópez, H., Rodriguez,S. & Viacava,G.(2020). Inventory Planning and Management in the Automotive After-Sales Supply Chain. View Article
[5] Carrion,I. , Castrejon,A., Gonzales,W.,Leiva,D.,Mostacero,Z. & Quispe,L (2022). Impact of the MRP technique on the Inventory Management of the Rosmery Bakery in the City of Cajamarca. Proceedings of the LACCEI international Multi-conference for Engineering, Education and Technology.
[6] Rajagopal, P; Tedjamulja, A; Tendulkar, A & Vaz, A (2020). Order frequency as a variable to determine slow moving D items in ABC inventory categorization. International Journal of Supply Chain Management, 9(2), 36-43.
[7] Siregar, I; Rizkya, I; Sari, R & Syahputri, K. (2020). Inventory Optimization in the Cigarette Industry. IOP Conference Series. Materials Science and Engineering; Bristol Tomo 851, N.º 1. h
[8] Farmaciawaty, D; Basri, M; Adiutama, A; Widjaja, F & Rachmania, I. (2020). Mejora del nivel de inventario en empresa de farmacia Uso del modelo EOQ probabilístico y el inventario de dos escalones: Un caso de estudio. The Asian Journal of Technology Management; Bandung. https://www.proquest.com/docview/2540832102/DF153687BA754CADPQ/4 View Article
[9] Barquero, W. (2022). Análisis de Prisma como Metodología para Revisión Sistemática: una Aproximación General. Revista Saúde em Redes, 339-360. View Article
[10] Payless Water Heaters. (2023). The importance of proper water heater installation. View Article
[11] Abdolazimi, O., Esfandarani, M.S. & Shishebori, D. (2021). Design of a supply chain network for determining the optimal number of items at the inventory groups based on ABC analysis: a comparison of exact and meta-heuristic methods. Neural Comput & Applic 33, 6641-6656. View Article
[12] Tratado de Libre Comercio entre el Perú y China. (s.f). Acuerdos comerciales del Perú. View Article
[13] SISTEMAS DE COLECTORES SOLARES. Método de ensayo para determinar la eficiencia de los colectores solares de placa plana (CPP). (2021). INACAL. View Article
[14] SISTEMAS DE CALENTAMIENTO DE AGUA CON ENERGÍA SOLAR. Fundamentos para dimensionamiento eficiente de colectores solares de placa plana (CPP). (2021). INACAL.1ª Edición. View Article
[15] ISO 50001 Gestión de la energía. (s.f). Normas ISO. https://www.normas-iso.com/iso-50001/ View Article
[16] Camacho,R., Macassi,I & Palomino,J (2022). Increasing the service level in an industrial supplier company using the Winters Forecasting Method, Lean Warehouse and BPM.Proceedings of the LACCEI international Multi-conference for Engineering, Education and Technology. View Article