International Journal of Environmental Pollution and Remediation (IJEPR)
ISSN: 1929-2732

Volume 10 - Year 2022 - Pages 01-08
DOI: 10.11159/ijepr.2022.001
Prediction of Organic Pollutants Transfers in Contaminated Soils Using an In-House Thermodynamic Calculator
Kouaho Kouame 1, Simon V. Ayache1, Pauline Michel1, Pascal Mougin1
IFP Energies nouvelles
1-4 avenue de Bois-Préau, 92852 Rueil-Malmaison, France
simon.ayache@ifpen.fr
Abstract - Regulations are becoming stricter and stricter regarding soil pollutions. At the same time the amount of money available to investigate the risks associated with soil pollutions remains limited. This paper proposes to investigate the transfer of pollutants by means of a quick running numerical tool. Indeed, this numerical tool based on equations of state has been developed to compute vapor-liquid or vapour-liquid-liquid thermodynamic equilibrium as a function of temperature and pressure. It has been specifically adapted for the study of organic pollutants in contaminated soils. This tool requires chemical information from the contaminated soil sample as input data. The soil must therefore be analysed to determine its characteristics and the total concentrations of pollutants. This information is used to calculate the overall mole fractions (zi) of each pollutant in the contaminated soil. These mole fractions are thus the input data for the numerical tool to perform the components or pollutants distribution calculation. The results of this tool, which is called Transfero-Pol, therefore depend on the input data obtained from the analysis of the contaminated soil. These results make it possible to understand the long-term distribution of pollutants within the different phases of the soil as a function of temperature. In this paper, the theory behind the numerical tool Transfero-Pol is derived. A case study is then presented to assess the results from Transfero-Pol by comparing them to the outputs of a commercial software.
Keywords: Contaminated soil, Organic components, Transfer, Thermodynamic.
© Copyright 2022 Authors - This is an Open Access article published under the Creative Commons Attribution License terms. Unrestricted use, distribution, and reproduction in any medium are permitted, provided the original work is properly cited.
Date Received: 2022-05-25
Date Accepted: 2022-05-31
Date Published: 2022-06-09
1. Introduction
According to the mid-2018 census, there were nearly 6800 contaminated sites and soils in France (see BASOL database). There are several types of pollution in soils including metal pollution (copper, lead, nickel, etc.), metalloid pollution (boron, arsenic, etc.) and Volatile Organic Components (VOCs: hydrocarbons). This paper presents a numerical tool that aims at investigating the evolution of hydrocarbons pollutants in the soil. In fact, this numerical tool computes thermodynamic flashes to determine the long-term distribution of pollutants in the different phases of the soil. By knowing which pollutants will end up in the aqueous or gaseous phases, namely the mobile phases, one can identify which pollutant is more likely to move from the original hydrocarbons pollution location and, for instance, contaminate the groundwater or be inhaled as vapor.
There are several existing numerical tools for studying the distribution of pollutants in the different phases of the soil. The numerical tools identified are NAPLANAL (Mariner et al, 1997), NAPLator (Rucker, 2003) and OREOS (Chastanet et al, 2012). These numerical tools allow to calculate and describe the distribution of organic pollutants in the different phases of the soil from their total quantities in the soil sample. Indeed, the transfer of organic pollutants between the different soil phases (aqueous phase, gas phase, NAPL phase and adsorbed phase) is generally described by the thermodynamic equilibrium laws at the soil pore scale.
The NAPLator software calculates the distribution of pollutants in the soil phases based on the assumption that the total mass composition of pollutants is equivalent to the composition of the organic phase. This assumption could induce errors in the results for soil samples containing a small amount of organic phase. The NAPLANAL tool calculates the distribution of pollutants in the phases without any assumptions on the composition. It is no longer available.
Furthermore, OREOS is the most recent software identified for the transfer of pollutants in the soil. It has been developed and improved compared to NAPLANAL and NAPLator. However, it has certain limits, particularly in terms of accounting for the variation of the physicochemical parameters of the pollutants (Henry's constant, Solubility, Vapor pressure) in relation to the temperature variation.
Thus, to resolve all these issues, a new numerical tool have been proposed for the study of the transfer of organic pollutants in the soil. Starting from a thermodynamic calculator previously used in the field of petroleum engineering, this numerical tool has been adapted to study the transfer of organic pollutants (hydrocarbons) between the various phases of the soil, namely the aqueous, gaseous and Non-Aqueous Phase Liquids (NAPL). It is based on equations of state, namely the Soreide-Whitson model (Soreide and Whitson, 1992) and works with VBA (Visual Basic for Applications) codes written in Excel software and libraries coded in Fortran. This thermodynamic tool determines the distribution of a component or a mixture of components among the three phases at a given temperature. It can be used to predict the long-term transfer of organic pollutants from the NAPL-phase to the mobile phases (aquifer, atmosphere) and estimate the sanitary risk. The tool can also be used to estimate some effects of thermal remediation treatments on hydrocarbons-impacted soils (Vidonish et al, 2019) without requiring dynamic numerical models (Xie et al, 2016).
The objective of this work is to describe the numerical tool and investigate its capability for the study of sites contaminated by hydrocarbons, with the final aim of providing an operational tool for risk assessment of polluted sites and soils.
2. Thermodynamic equations
2. 1. Description of the thermodynamic calculator Transfero-Pol
Transfero-Pol is a numerical tool used for calculations of vapor-liquid or vapor-liquid-liquid equilibriums. It is used to determine the distribution of components in three phases (aqueous phase, non-aqueous phase (NAPL) and gas phase) from their proportions (overall mole fractions) in an initial mixture. This distribution is a function of the pressure and temperature conditions of the medium. Transfero-Pol is based on the equations of state (EOS) as proposed by Soreide and Whitson. The main equations integrated in the Transfero-Pol tool are as follows:
The basic equation is the Peng-Robinson equation of state (Peng and Robinson, 1980). It relates the Pressure P [Pa] to the temperature T [K] and the molar volume V [m3/mol]. R [J/mol.K] is the ideal gas constant. The covolume of the mixture b is defined from the covolumes of each pure component bi and the different mole fractions xi :

For a mixture including components i and j and water, Soreide and Whitson proposed two different EOS constants a(T). One is determined for the non-aqueous phase ![]() and the other for the aqueous phase
and the other for the aqueous phase ![]() . These are expressed as a function of the respective phase binary interaction parameters
. These are expressed as a function of the respective phase binary interaction parameters ![]() and
and ![]() , and mole fractions xi.
, and mole fractions xi.
The attraction terms for pure component ai are defined as follows:
The parameter α(Tri) is defined for hydrocarbons and for pure water:


Furthermore, the binary interaction parameters ![]() and
and ![]() are empirical correlations depending on the temperature, and the critical temperature of component i (i = hydrocarbon components and j = water). A default value of
are empirical correlations depending on the temperature, and the critical temperature of component i (i = hydrocarbon components and j = water). A default value of ![]() equal to 0.5 is used for hydrocarbon and water binaries in non-aqueous phase.
equal to 0.5 is used for hydrocarbon and water binaries in non-aqueous phase. ![]() is calculated with the following expressions:
is calculated with the following expressions:
The constants A, B and C are determined to reproduce the experimental data for solubility and water content of the non-aqueous phases. The determination of these parameters is based on the values of Henry's constant of the components in pure water and the fugacity coefficient of components infinitely diluted in water. Thus, it is possible to include a specific binary interaction parameter between water and a new component added to Transfero-pol. This method is an extension of the Soreide and Whiston model.
This extension of the Soreide and Whiston model was implemented to calculate phase equilibria between an aqueous phase and one or two hydrocarbon phases (liquid and gas). It also makes it possible to calculate the distribution of a mixture of components in these different phases according to the pressure and temperature. Transfero-Pol can therefore be used to study the distribution of hydrocarbon pollutants in the aqueous, gaseous and non-aqueous liquid (NAPL) phases in the soil. It should be noted that no adsorbed phase is taken into account in the equations used by Transfero-Pol.
2. 2. Transfero-Pol input and output data
The input data of the thermodynamic tool Transfero-Pol are the overall mole fractions of the considered components and the temperature, the pressure being the atmospheric one for most of the applications. However, in general, laboratory results for contaminated soil samples are given in total mass concentration for each pollutant in the soil. Thus, to perform contaminated sites and soils analysis with Transfero-Pol, it is necessary to convert the mass concentrations of pollutants in the soil into overall mole fractions. The conversion of the data is done by the following relations:
where zi is the overall mole fraction of component i in the mixture or in the contaminated soil; ![]() is the amount of substance i in the soil;
is the amount of substance i in the soil; ![]() [mg/kg] is the total mass concentration of component i in the soil;
[mg/kg] is the total mass concentration of component i in the soil; ![]() [g/mol or mg/mol or Kg/mol] is the component molecular weight and
[g/mol or mg/mol or Kg/mol] is the component molecular weight and ![]() [Kg] is the mass of contaminated soil sample. For all components i, the sum of overall mole fractions must have a value equal to 1:
[Kg] is the mass of contaminated soil sample. For all components i, the sum of overall mole fractions must have a value equal to 1:

In situ measurements in contaminated sites or laboratory results for contaminated soil samples can give the concentrations of pollutants in the different soil phases at a given time. These concentrations can be converted into mole fractions and used with Transfero-Pol to study the evolution of the distribution of pollutants in the different phases of the soil as a function of temperature and pressure. The following relationships are used to convert the data:


where ![]() [mol] is the amount of substance i in the considered phase (water / aqueous phase, gas and NAPL);
[mol] is the amount of substance i in the considered phase (water / aqueous phase, gas and NAPL);![]() [Kg/m3] is the concentration of component i in the considered phase ;
[Kg/m3] is the concentration of component i in the considered phase ; ![]() [m3] is the volume of contaminated soil sample;
[m3] is the volume of contaminated soil sample; ![]() is the total porosity of contaminated soil sample;
is the total porosity of contaminated soil sample; ![]() is the mole fraction of component i in the considered phase and
is the mole fraction of component i in the considered phase and ![]() [adim] is the saturation of the phase considered, defined as:
[adim] is the saturation of the phase considered, defined as:
with Vphase the volume of the phase in the pores. We have:
Furthermore, to take into account the volumetric water content ![]() and the volumetric air content
and the volumetric air content ![]() in the soil, the component water (H2O) and air (Nitrogen N2 and Oxygen O2) must be added systematically to the list of components in the mixture to be treated with Transfero-Pol. To determine the mole fractions of water and air in the soil, their amount of substance in the soil must be calculated. The following equations can be used:
in the soil, the component water (H2O) and air (Nitrogen N2 and Oxygen O2) must be added systematically to the list of components in the mixture to be treated with Transfero-Pol. To determine the mole fractions of water and air in the soil, their amount of substance in the soil must be calculated. The following equations can be used:
where ![]() [mol] and
[mol] and ![]() [mol] are respectively the amount of water (H2O) and air substances in the soil;
[mol] are respectively the amount of water (H2O) and air substances in the soil; ![]() [Kg/m3]is the density of soil and pwater [Kg/m3] is the density of water and pair [Kg/m3] is the density of air. The amount of air is divided between N2 and O2. Knowing that air contains about 78% of N2 and 22% of O2 in moles, we can obtain nN2[mol] and no2[mol] in the soil:
[Kg/m3]is the density of soil and pwater [Kg/m3] is the density of water and pair [Kg/m3] is the density of air. The amount of air is divided between N2 and O2. Knowing that air contains about 78% of N2 and 22% of O2 in moles, we can obtain nN2[mol] and no2[mol] in the soil:
It should be noted that Transfero-Pol output data are the mole fractions of each component of the initial mixture in the different phases of the soil: aqueous phase, gas phase and non-aqueous phase (NAPL).
3. Case study
3. 1. Presentation of the case study
An example of a case study has been used by the company BURGEAP to evaluate the results of the OREOS software. In this section, the same case study was used to compare the results of Transfero-Pol and OREOS. Indeed, OREOS is a software developed in the years 2012-2015 by the company BURGEAP and by ADEME (Agence de l'Environnement et de la Maitrise de l'Energie, France). It calculates the distribution of organic pollutants in the different phases of the soil from their total mass concentrations measured in a contaminated soil sample (Chastanet et al, 2012). BURGEAP has used a case study with petroleum hydrocarbon data taken from Mariner et al. (1997) to test the OREOS software. The same data were used to compare the results of OREOS and Transfero-Pol.
This case study considers a soil sample contaminated with C6 through C9 n-aliphatic hydrocarbons (hexane, heptane, octane, nonane). In the soil sample, each component has a same total mass concentration value that is equal to 250 mg.kg-1. The physical and chemical properties of the hydrocarbon components and the soil sample are given below in Tables 1, 2 and 3.
Table 1. Physical and chemical properties data used in the case study (from Chastanet et al, 2012).
|
Component i |
Mole mass Mwi (g/mol) |
Mass Volume ρi [kg/L] |
Solubility Si (mg/l) |
|
Hexane |
86.07 |
0.66 |
12.31 |
|
Heptane |
100.2 |
0.68 |
3.06 |
|
Octane |
114.22 |
0.7 |
0.68 |
|
Nonane |
128.26 |
0.72 |
0.47 |
Table 2. Physical and chemical properties data used in the case study (from Chastanet et al, 2012).
|
Component i |
Henry’s constant KHi |
Carbon partition coefficient organic/water Koci (mL/g) |
Total component concentration in soil Ci (mg/kg) |
|
Hexane |
46.49 |
6025.60 |
250 |
|
Heptane |
63.59 |
22908.68 |
250 |
|
Octane |
95.74 |
77624.71 |
250 |
|
Nonane |
45.80 |
263026.8 |
250 |
Table 3. Soil Sample Data
|
Organic carbon content foc |
0.01 |
|
Volumetric water content Φw |
0.08 |
|
Total porosity |
0.4 |
|
Temperature |
25°C |
From these data, the OREOS software has calculated the distribution of components in the different phases of the soil sample. OREOS results have given the mass concentrations of each compound in the aqueous phase, gas phase, NAPL phase and adsorbed phase. For a direct comparison with Transfero-Pol results, the mass concentrations given by OREOS were converted to mole fractions and the adsorbed phase was not considered.
To perform the same thermodynamic calculation with Transfero-Pol, the overall mole fractions (zi) of each component in the soil were calculated using the equations described in Section 2.2. The results are presented in Table 4.
Table 4: Transfero-Pol input data for the case study.
|
Component i in the mixture |
Overall mole fraction (zi) in soil |
|
Water (H2O) |
0.99598 |
|
Nitrogen (N2) |
0.00231 |
|
Oxygen (O2) |
0.00065 |
|
Hexane |
0.00033 |
|
Heptane |
0.00027 |
|
Octane |
0.00029 |
|
Nonane |
0.00015 |
From these overall mole fractions (zi), Transfero-Pol was used to calculate the distribution of the components in the different phases of the soil. Transfero-Pol and OREOS results were then compared as reported in the following section.
3. 2. Comparison of OREOS and Transfero-Pol results
To compare the results of OREOS and Transfero-Pol, only the hydrocarbon components must be considered, i.e. Hexane, Heptane, Octane and Nonane. The computed mole fractions of each pollutant in each phase are summarized in Tables 5, 6 and 7. These mole fractions are graphically represented in Figures 1, 2 and 3. This representation makes it easier to read and compare OREOS and Transfero-Pol results.
Table 5. Comparison of Transfero-Pol and OREOS results
|
Component i |
Mole fraction (wi) in the aqueous phase |
|
|
Transfero-Pol |
OREOS |
|
|
Hexane |
0.785 |
0.767 |
|
Heptane |
0.157 |
0.178 |
|
Octane |
0.049 |
0.042 |
|
Nonane |
0.008 |
0.014 |
Table 6. Comparison of Transfero-Pol and OREOS results
|
Component i |
Mole fraction (xi) in NAPL phase |
|
|
Transfero-Pol |
OREOS |
|
|
Hexane |
0.187 |
0.246 |
|
Heptane |
0.266 |
0.266 |
|
Octane |
0.355 |
0.319 |
|
Nonane |
0.192 |
0.169 |
Table 7. Comparison of Transfero-Pol and OREOS results
|
Component i |
Mole fraction (yi) in the gas phase |
|
|
Transfero-Pol |
OREOS |
|
|
Hexane |
0.670 |
0.692 |
|
Heptane |
0.238 |
0.219 |
|
Octane |
0.079 |
0.077 |
|
Nonane |
0.014 |
0.012 |
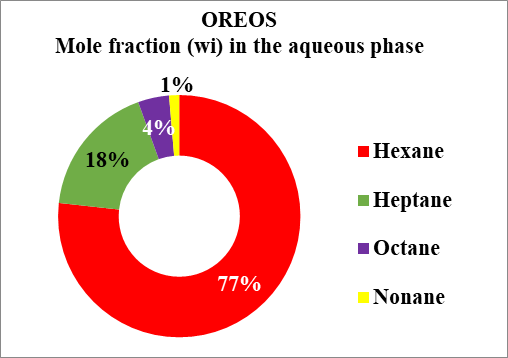
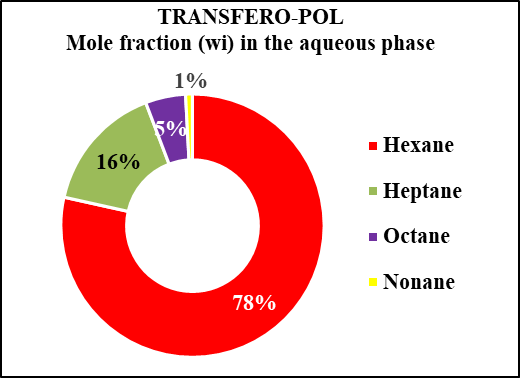
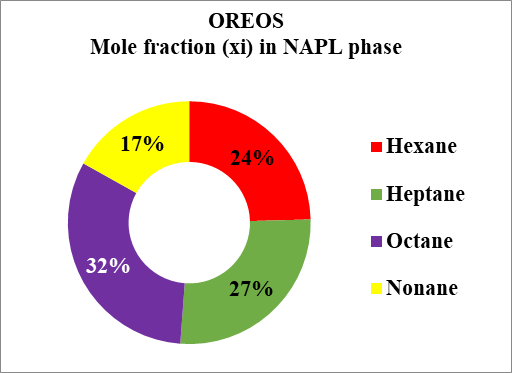
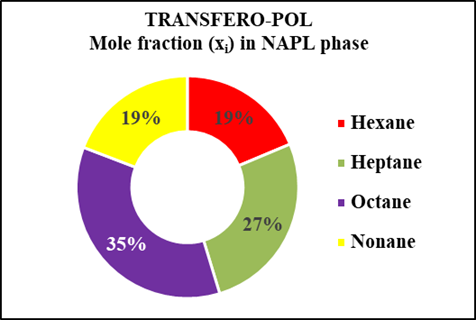
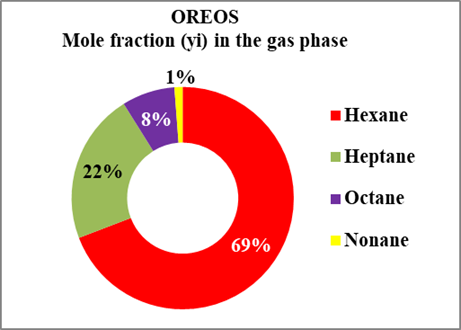
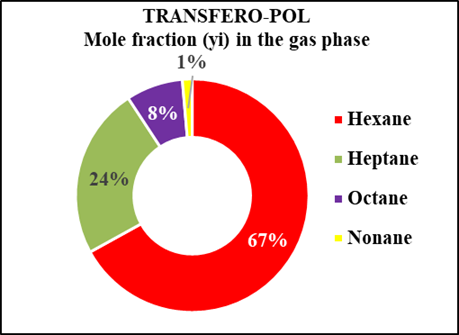
In the water phase, OREOS and Transfero-Pol results are 1% different for Hexane and Nonane and 2% different for Heptane. In the gas phase, the results of the two softwares show a difference of 2% for Hexane and Heptane. Finally, in the NAPL phase, OREOS and Transfero-Pol results are 5% different for Hexane, 3% for Octane and 2% for Nonane.
For a temperature at 25°C, the Henry's constants used to calibrate Transfero-Pol and to run OREOS are presented in Table 8. These Henry’s constants are different. Thus, the differences observed in the composition of the aqueous, gaseous and NAPL phases are partially caused by these discrepancies. Furthermore, Transfero-Pol and OREOS use different calculation methods. Transfero-Pol is based on the computation of Equation of State while OREOS uses the laws of interaction and exchange between the different soil phases based on parameters for each component such as its solubility and its Henry's constant.
Table 8: Henry’s constants used by Transfero-Pol for its calibration and by OREOS for its computation
|
Component i |
Henry’s constant KH [bar] |
|
|
Transfero-Pol |
OREOS |
|
|
Hexane |
0.85 |
0.90 |
|
Heptane |
1.51 |
1.23 |
|
Octane |
1.60 |
1.86 |
|
Nonane |
1.60 |
0.88 |
4. Conclusion
This paper presents a numerical tool, called Transfero-Pol, that aims at predicting the long-term evolution of hydrocarbons pollutants in contaminated soils. This tool is based on the computations of vapor-liquid thermodynamic equilibrium that provide the distribution of pollutants among the different phases. The three phases considered here are the NAPL, aqueous and gaseous phases. It is expected that the pollutants remaining in the NAPL phase will not move while the pollutants migrating to the aqueous and gaseous phases will follow their phase motion and therefore create a sanitary risk, for instance by contaminating the groundwater or by being inhaled as vapor. The calculation inputs of the tool are based on laboratory analysis of a contaminated soil sample to determine its physical and chemical characteristics, with measurements of the total concentrations of each pollutant in the soil sample. From this information, the overall mole fractions of each pollutant in the soil can be derived and Transfero-Pol can then calculate the distribution in mole fractions of the pollutants in the aqueous, gas and NAPL phases in the soil.
In this paper a case study was used to assess the performances of Transfero-Pol by comparing it with results from a commercial software. The results show that Transfero-Pol results are comparable to the results of the OREOS commercial software. The information provided by Transfero-Pol can therefore be used for the diagnosis of contaminated soils and for the selection of suitable soil remediation techniques.
References
[1] BASOL database website (2020): View Article
[2] Mariner P. E., Minquan J. Richard E. J., “An algorithm for the estimation of NAPL saturation and composition from typical soil chemical analyses”, Ground Water Monitoring and Remediation., pp.122-129, Spring 1997. View Article
[3] Rucker G. G., 2003. Method and software to determine and quantify Non-Aqueous Phase Liquids in Environmental Media. Calculation Cover Sheet, Savannah River Site, pp. 42
[4] Chastanet J., Kaskassian S., Côme J.-M. (2012, December 5). “Développement d’un outil de calcul de la répartition de la phase organique dans les sols”. Online available: View Article
[5] Soreide, I., and Whitson, C., “Peng - Robinson predictions for hydrocarbons, CO2, N2, H2S with pure water and NaCl brine,” Fluid. Phase. Equil., 77, pp. 217-240, 1992. View Article
[6] Vidonish J. E., Zygourakis K., Masiello C. A., Sabadell G., Alvarez P. JJ., “Thermal Treatment of Hydrocarbon-Impacted Soils: A Review of Technology Innovation for Sustainable Remediation”, Engineering, pp. 426-437, Volume 2, Issue 4, 2016. View Article
[7] Xie Q., Mumford K. G., Kueper B. H., Zhao C., “A numerical model for estimating the removal of volatile organic compounds in laboratory-scale treatability tests for thermal treatment of NAPL-impacted soils”, Journal of Contaminant Hydrology, Volume 226, 2019 View Article
[8] Peng, D. and Robinson, D., “Two and three phase equilibrium calculations for coal gasification and related processes,” In S.A. Newman (Ed), Thermodynamics of aqueous systems with industrial applications., ACS symposium Ser., pp. 393-414, 1980. View Article