International Journal of Environmental Pollution and Remediation (IJEPR)
ISSN: 1929-2732

Volume 9 - Year 2021 - Pages 12-21
DOI: 10.11159/ijepr.2021.002
Impact of COVID-19 lockdown on air quality of Sri Lankan cities
Mahesh Senarathna1,2, Rohan Jayaratne3, Lidia Morawska3, Yuming Guo4, Luke D. Knibbs5, Dinh Bui6, Sachith Abeysundara7, Rohan Weerasooriya1, Gayan Bowatte1,6,8
1National Institute of Fundamental Studies, Hantana Road, Kandy, Sri Lanka
mahesh.se@nifs.ac.lk; rohan.we@nifs.ac.lk
2Postgraduate Institute of Science, University of Peradeniya, Sri Lanka
3International Laboratory for Air Quality and Health, Queensland University of Technology, Brisbane, Australia
r.jayaratne@qut.edu.au; l.morawska@qut.edu.au
4Monash University, Public Health and Preventive Medicine, Melbourne, Australia
Yuming.guo@monash.edu
5School of Public Health, Faculty of Medicine, University of Queensland, Brisbane, Australia
l.knibbs@uq.edu.au
6Melbourne School of Population and Global Health, University of Melbourne, Australia
Dinh.bui@unimelb.edu.au; gayan.bowatte@unimelb.edu.au
7Department of Statistics and Computer Sciences, Faculty of Science, University of Peradeniya
Sachith.me@gmail.com
8Department of Basic Sciences, Faculty of Allied Health Sciences, University of Peradeniya
gayan.bowatte@ahs.pdn.ac.lk
Abstract - The COVID-19 pandemic has led to the complete lockdown of many cities worldwide. Lockdowns have significantly changed human behaviour, such as fewer or no industrial activities and limited road and air transport, affecting the environment. In this study, we aimed to assess the variability and trends of PM2.5 (mass concentration of airborne particulate matter < 2.5µm) and carbon monoxide (CO) before and during the COVID-19 lockdown period in Sri Lanka. Data were collected in “Urban Background”, “Public & Mixed Residential”, and “Primary Residential” areas using small sensor technology, "KOALA" air quality sensor units, from five locations, three in Kandy, and two in Colombo city. Daily averages (24h) and daytime averages (08:00 AM to 8:00 PM) were calculated for the period before (before March 20th) and during (March 20th to May 10th) the lockdown. Air pollutions level before & during COVID-19 lockdown were compared, then Mann-Kendall and Sen's slope tests were performed to determine trends of PM2.5 and CO, and the magnitude of the trend. Meteorological parameters were fairly similar before and during both cities' lockdown periods, while both PM2.5 and CO concentrations declined. The highest average reductions of PM2.5 and CO were observed in Colombo's “Urban Background” area (52.4% and 46.7%, respectively). In Kandy, “Urban Background” site had a higher reduction of PM2.5 and CO (30.2% and 41.2%, respectively), compared to “Primary Residential” (10% and 9%, respectively). The daily averages of the pollutants' concentrations were higher before the lockdown period compared to during. Overall, a significant downward trend was observed of air pollutants over the entire study period. In Sri Lanka, the COVID-19 lockdown improved air quality significantly in urban areas.
Keywords: Pandemic, Air Pollution, Small sensors, Air quality monitoring, Sri Lanka
© Copyright 2021 Authors - This is an Open Access article published under the Creative Commons Attribution License terms. Unrestricted use, distribution, and reproduction in any medium are permitted, provided the original work is properly cited.
Date Received: 2021-03-26
Date Accepted: 2021-05-27
Date Published: 2021-07-05
1. Introduction
The COVID-19 worldwide pandemic has significantly changed human behaviour and its impact on the environment. The pandemic has led to the complete lockdown of many cities worldwide. Industrial production and supply lines have been drastically reduced, leading to fewer or no industrial activities and limited transport. As a result, the burning of fossil fuels and subsequent atmospheric pollution have decreased dramatically [1],[2].
Similar to other countries the pandemic caused the lockdown of cities in Sri Lanka, where the main source of ambient air pollution is vehicle emissions in urban areas. Vehicle emissions contribute more than 60% of the ambient air pollution in Colombo, the capital of the country [3]. Several studies have recently reported on the effect of the COVID-19 lockdown on the level of environmental pollution, especially air pollution, in many of the world's major cities. Compared to pre-lockdown levels, the concentration of airborne particulate matter less than 2.5 µm in diameter (PM2.5) and particulate matter less than 10 µm in diameter (PM10) reduced by about half in Delhi, India [4], and concentrations of PM2.5, PM10, and NO2 reduced by 38–78%, 32–80%, and 30–84%, respectively, in the state of Gujarat, western India [5]. Levels of CO, NO, and NO2 decreased by 64.8%, 77.3%, 54.3%, respectively, in urban areas of the state of São Paulo, Brazil [6] during partial lockdown compared to the five-year monthly mean. Similarly, Liu et al. [7] reported that ground-based observations around California showed a 38%, 49%, and 31% drop in the concentration of NO2, CO, PM2.5, respectively, during their lockdown (March 19th–May 7th, 2020) compared to before (January 26th –March 18th, 2020). In Wuhan city, China, Lian et al. [8] found that PM2.5 decreased by 36.9% during the lockdown and remained the city's primary pollutant.
In Sri Lanka, the first case of COVID-19 was reported in late January 2020. Since then, the Government of Sri Lanka has introduced various sequential measures to control the spread of COVID-19, including social distancing and, from March 20th to May 10th, 2020, an island-wide curfew. Colombo and Kandy districts were identified as high-risk zones because of the rapid spread of COVID-19. Public transport within these cities was limited during the lockdown period; however, activities related to health and essential services were not suspended. These restrictions affected normal human activities resulting in fewer motor vehicles on the roads. Although many cities in the South Asian region have assessed how the COVID-19 pandemic has impacted air quality [9]–[12] results are not generalizable due to different geography, environmental, and socioeconomic characteristics and air quality patterns. In Sri Lanka air pollution is a major environmental issue, a local study can capture patterns of change in air pollution that can be used for future air quality control. In this study, an already existing smart sensor network has been used to assess the variability and trends of PM2.5 and CO before and during the COVID-19 lockdown period in the city of Colombo (the capital) and Kandy (second largest city) of Sri Lanka using smart sensor technology.
2. Materials and Methods
2.1. Study Area
The present study focused on two major municipality areas in Sri Lanka, namely Colombo Municipal Council (CMC) and Kandy Municipal Council (KMC). The CMC is the municipal governing body of Colombo, the largest city and commercial capital of Sri Lanka, with 555,031 inhabitants covering an area of 37 km2. Its daily population expands by a 'floating population' of nearly 500,000 [13]. The KMC is the local council for Kandy, the second-largest city of Sri Lanka, with 113,000 inhabitants and covers an area of 28.53 km2 [14]. This study collected data from five sites; two in Colombo and three in Kandy. In Colombo, both monitoring sites (Figure 1) were located in an Urban Background (UB). In Kandy, the three selected locations (Figure 2) represented Urban Background, Primary Residential (PR), and Public & Mixed Residential (PMR) areas.
Each site was chosen because they were representative locations of the city, with different characteristics such as major roads, population density, land use, etc. Information of sensor locations and air pollution measuring periods are provided in Table 1. Data on rainfall, relative humidity, the temperature was obtained from the meteorology department of Sri Lanka.
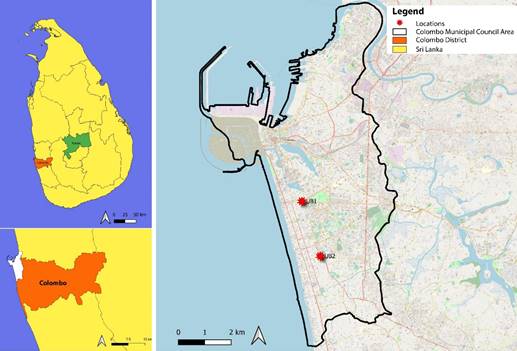
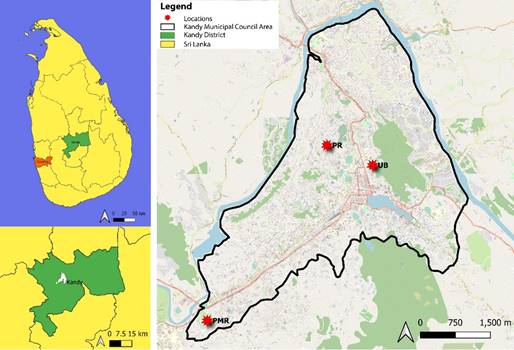
Table 1. Geographic location and their background type of air quality monitor stations
| City | Background type | Device ID | Longitudes | Latitude |
Monitoring Period |
|
Colombo |
Urban background 1 (UB1) |
1 |
79.8553 |
6.9122 |
2020.02.09– 2020.04.15 |
|
Urban background 2 (UB2) |
2 |
79.8616 |
6.8933 |
2020.03.01– 2020.05.10 |
|
|
Kandy |
Urban background (UB) |
3 |
80.638696 |
7.298821 |
2020.03.03– 2020.05.10 |
|
Primary Residential (PR) |
4 |
80.629869 |
7.302681 |
2020.02.10– 2020.05.10 |
|
|
Public & Mixed residential (PMR) |
5 |
80.606658 |
7.268675 |
2020.02.12– 2020.05.10 |
2.2. Air Pollution Data Collection
Air pollution data were collected before and during the 2020 lockdown period. Data on the particulate matter with a diameter of <2.5 µm (PM2.5) and <10 µm (PM10) and carbon monoxide (CO) were collected using a low-cost small air quality sensor unit called Knowing Our Ambient Local Air-quality (KOALA). The KOALA monitor has been developed by the International Laboratory for Air Quality and Health (ILAQH) at the Queensland University of Technology (QUT), Brisbane, Australia, and measures PM2.5 and CO concentrations [15]. Each unit contains two low-cost air quality sensors; a. Plantower PMS1003 sensor measures aerosol particles and an Alphasense CO sensor [16] measures CO. Both the Plantower PM2.5 sensor [17], [18] and the Alphasense CO sensor [19], [20] were tested and calibrated in the laboratory and under ambient conditions before the monitoring campaign. The Plantower PMS1003 uses a laser scattering principle to irradiate suspended particles in the air. It then determines the size and concentration of the particles using the intensity of the scattered light spikes and the number of spikes, respectively [21]. The sensor's on-board microcontroller then calculates and reports the particulate mass concentrations in units of µg/m3 in three size ranges, up to 1.0 µm, 2.5 µm, and 10.0 µm. The KOALA air pollution sensor units were programmed to record data every 5 min, and wirelessly transmit the readings at intervals of 35 min to a cloud-based storage facility built on Amazon Web Services. The downloaded data were then organized in spreadsheets as 1-hour means for further analysis. Daytime averages were also obtained from 08.00 AM to 08:00 PM each day because human activities were most affected by the curfew during these times. Previous research published by R. Jayaratne et al. [17] reported that the KOALA devices performed well at a relative humidity of less than 75%. In this study, the daily average PM2.5 values were significantly affected by humidity interference of the PMS1003 sensor during the nights. High humidity levels can affect the particulate matter readings; this happens mostly during the night, where humidity is relatively high [17]. Since particulate matter readings are generally lower at night, daily averages which include night-time data tend to be over-estimated. Since CO sensor readings are not affected by humidity, this over-estimation issue was corrected by using the following equation on 24-hour CO averages. So, Eq. 1 was used to compute the daily averages.

Daily averages (24h) and daytime averages were calculated for the period before (before March 20th) and during (March 20th to May 10th) the COVID-19 lockdown.
2.3. Statistical Analysis
The R software (version 4.0.2) [22] was used in all statistical analyses. Descriptive statistics and data visualizing of the pollutants were obtained using the "open-air" package [23] and time-series plots. Daily and daytime data were not normally distributed for all locations. A comparison of the results obtained on different days of each period (before/during the lockdown period) was calculated using the Mann-Whitney U test. The Mann-Kendall test [24] was then performed to determine whether a time series had a monotonic upward or downward trend. The null hypothesis for this test assumed that there was no monotonic trend in the series. After the Mann-Kendall test, the Sen's slope [25] was performed to calculate the magnitude of the trend in a variable. Sen's slope is considered superior for detecting a linear relationship as it is not affected by outliers in the dataset. Meteorological parameters were compared before and during the lockdown periods using non-parametric methods.
3. Results and Discussion
3.1. Comparison of Pollution Levels before and During the COVID-19 Lockdown Period
From 08:00 AM to 8:00 PM (local time) daily, the 1- hour average of PM2.5 and CO in each location was calculated and shown as box plots (Figure S1). Table 2 shows the daily and daytime average of PM2.5 and CO before and during the lockdown period at the five monitoring sites. Two monitoring locations in Colombo (Urban Backgrounds 1 and 2), showed a significant reduction in the average daytime PM2.5 (41% and 51.6%, respectively) during the lockdown period when compared to the pre-lockdown period. Similarly, for CO the daytime average reduction was 54.3% and 46.5%, respectively. This considerable reduction is almost certainly due to the restriction on transport and industrial activities.
Table 2. Daily, a daytime average of PM2.5 and CO before & during the curfew period in five monitoring locations
|
|
Background type |
Air pollutant |
Average by |
Before curfew |
During curfew |
Variation |
|
|
change |
(%) |
||||||
|
Colombo |
UB1 |
PM2.5 (µg/m3) |
Daily averages |
49.6 |
31.1 |
-18.4 |
-37.2 |
|
Daytime Averages |
52.7 |
31.1 |
-21.6 |
-41.0 |
|||
|
CO (ppm) |
Daily averages |
0.8 |
0.4 |
-0.4 |
-51.2 |
||
|
Daytime Averages |
0.8 |
0.4 |
-0.4 |
-54.3 |
|||
|
UB2 |
PM2.5 (µg/m3) |
Daily averages |
52.4 |
25.0 |
-27.4 |
-52.4 |
|
|
Daytime Averages |
53.1 |
25.7 |
-27.4 |
-51.6 |
|||
|
CO (ppm) |
Daily averages |
0.5 |
0.3 |
-0.2 |
-46.7 |
||
|
Daytime Averages |
0.5 |
0.3 |
-0.3 |
-46.5 |
|||
|
Kandy |
UB |
PM2.5 (µg/m3) |
Daily averages |
40.7 |
28.4 |
-12.3 |
-30.2 |
|
Daytime Averages |
46.2 |
32.3 |
-13.9 |
-30.1 |
|||
|
CO (ppm) |
Daily averages |
0.7 |
0.4 |
-0.3 |
-41.2 |
||
|
Daytime Averages |
0.8 |
0.5 |
-0.3 |
-41.1 |
|||
|
PR |
PM2.5 (µg/m3) |
Daily averages |
34.6 |
31.1 |
-3.5 |
-10.2 |
|
|
Daytime Averages |
36.9 |
33.2 |
-3.7 |
-10.1 |
|||
|
CO (ppm) |
Daily averages |
0.4 |
0.4 |
0.0 |
-9.1 |
||
|
Daytime Averages |
0.4 |
0.4 |
0.0 |
-9.2 |
|||
|
PMR |
PM2.5 (µg/m3) |
Daily averages |
36.4 |
29.5 |
-7.0 |
-19.1 |
|
|
Daytime Averages |
38.4 |
30.7 |
-7.7 |
-20.0 |
|||
|
CO (ppm) |
Daily averages |
0.5 |
0.4 |
-0.1 |
-19.4 |
||
|
Daytime Averages |
0.6 |
0.4 |
-0.1 |
-20.6 |
|||
Transport (emission from motor vehicles), industry (power generation) and domestic uses can be identified as the main sources of air pollution in Sri Lanka [26]. In 2011, Motor vehicle emissions accounted for 55-60% of air pollution, industrial emissions of 20-25%, and domestic emissions of about 20% sources [27]. In Kandy, the Urban Background monitor showed average daytime reductions of 30.1%, 41.1% for PM2.5 and CO, respectively. Since Colombo is a commercial city and more crowded than Kandy, heavier traffic conditions are regularly observed. Therefore, it is not surprising that the air pollution reduction value was much higher in Colombo's Urban Background area than in Kandy's Urban Background area during the lockdown period. In Kandy's Public and Mixed Residential areas, concentrations of PM2.5 and CO were reduced by 20% and 20.6%, respectively, during the lockdown period. The air pollution reduction level in Public & Mixed residential sites was lower than the Urban Background site in Kandy, and the lowest reduction level of PM2.5 and CO was observed at the Primary Residential site(−10% and -9%, respectively). A previous study on determination of source apportionment has revealed that high traffic volumes in urban areas results in high level of air pollution, while firewood cooking in rural residential areas [28]. On a regular working day, primarily residential areas have less traffic on roads and fewer industrial activities than urban and public mixed residential areas. Therefore, the effect of lockdown amid the COVID-19 pandemic on air quality may not be as significant in primary residential areas. Before the lockdown period, the World Health Organization Air Quality Guideline (WHO AQG) daily reference value of 25μg/m3 [29] was exceeded for all these monitoring locations (56% to 100% of days).
The Mann-Whitney U –test was used to compare results obtained on different days before and during the curfew period because data were not normally distributed for all locations. One-sided Mann-Whitney U-test results (Table 3) determined all monitoring locations showed a p-value less than the significance level 0.05, except the Primary Residential in Kandy. The median concentrations of both PM2.5 and CO before the lockdown period were more significant than those observed during the lockdown period.
Table 3. Mann-Whitney U-test results
| Test apply for | output | Colombo | Kandy | |||
| UB1 | UB2 | UB | PR | PMR | ||
| PM2.5 | w | 703 | 519 | 314 | 889 | 924 |
| p-value | <0.0001* | <0.0001* | 0.0410* | 0.114 | 0.032* | |
| PM10 | w | 697 | 522 | 317 | 899 | 928 |
| p-value | <0.0001* | <0.0001* | 0.0356* | 0.09 | 0.0298* | |
| CO | w | 806 | 561 | 439 | 1049 | 1124 |
| p-value | <0.0001* | <0.0001* | <0.0001* | 0.006 | <0.0001* | |
3.2. The Trend of Air Pollution before and During the COVID-19 Lockdown Period
Daily variations of PM2.5, CO, and their trends before and during the COVID-19 lockdown period (entire study period) for each location are shown in Figure 3 & Figure 4. Both figures indicate that PM2.5 and CO levels declined in time. Other monitoring sites also showed similar trends (Figure S2).
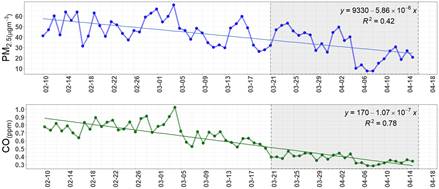
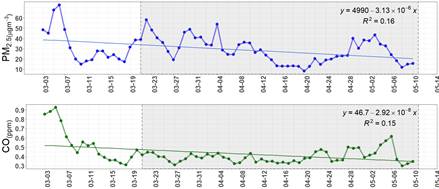
Table 4 shows the Mann-Kendall test results for the statistical significance of the trends and their respective magnitude rate using Sen's slope. Downward trends were observed with the time for PM2.5 and CO at all locations. This reduction was significant at the 95% confidence level for both PM2.5 and CO at all monitoring locations, except for Kandy's Primary Residential area. Sen's Slope estimator (Q) was used to verify the magnitude of the trend rate. All the Sen's Slope estimator values were negative, indicating the decreasing trend rate was significant for both PM2.5 and CO in all locations, except for Kandy's Primary Residential area.
Table 4. Mann-Kandle and Sen's slope analysis test results of air pollutants for before and during COVID-19 lockdown in five locations
|
City |
Background type |
Test |
PM2.5 |
CO |
|
Colombo (CMC) |
UB1 |
ZS |
-5.257* |
-8.157* |
|
Q |
-0.496* |
-0.009* |
||
|
UB2 |
ZS |
-6.126* |
-6.169* |
|
|
Q |
-0.538* |
-0.001* |
||
|
Kandy (KMC) |
UB |
ZS |
-2.958* |
-2.346* |
|
Q |
-0.234* |
-0.019* |
||
|
PR |
ZS |
-1.945 |
-1.818 |
|
|
Q |
-0.092 |
-0.0003 |
||
|
PMR |
ZS |
-2.810* |
-4.426* |
|
|
Q |
-0.152* |
-0.001* |
ZS: Mann-Kendall test, Q: Sen's slope estimator.
⁎Statistically significant of trends, at the 5% significance level.
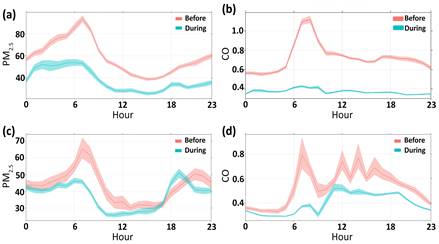
3.3. Diurnal variation
Diurnal variation was obtained for both pollutants (PM2.5 and CO) in Colombo and Kandy. In Figure 5, the red and blue lines indicate the diurnal variation before and during the lockdown period, respectively. Figure 5(a) and Figure 5(c) show that the diurnal variation of PM2.5 before lockdown had the same pattern and lower values as during the lockdown period. The CO levels were also higher before lockdown than during the lockdown period. The difference of both PM2.5 and CO before and during the lockdown was higher in Colombo compared with Kandy.
3.4. Meteorological Parameters
Relevant meteorological parameters had the same pattern before and during the lockdown period in both Colombo and Kandy (Figure S3). In Kandy, the deference between meteorological parameters is more or less similar before and during the lockdown periods. However, in Colombo, there was a difference between the main meteorological parameters (Table S1). This was mainly due to the few days of rainfall in the latter part of the lockdown period.
Overall, a significant downward trend of air pollutants was observed over the entire study period. The rate of air pollution reduction also changes according to the type of monitoring site. Specifically, the Urban Background sites had the largest decrease, followed by Primary Residential with Primary Residential in Kandy the flattest decrease. Similar findings have also been recorded across the South-Asian region and globally [30]. Masum & Pal [9] report reductions of ~40% in PM2.5 and ~30% in PM10 during the COVID-19 lockdown period in Chittagong city, Bangladesh. Sharma et al. [10] report a maximum decline concentration of 58.2% in PM2.5 and 44.7% in PM10 in Bhiwadi, Rajasthan, India, during their lockdown period in comparison with before the lockdown period while Singh & Chauhan [11], report PM2.5 reduced by 34.5% and 27.6% in Kolkata and Delhi, respectively, and that improvement in air quality is mainly due to the lockdown. Ahmed Khan et al. [31] report that the Pakistani lockdown (March to May 2020) led to a significant decline of (35% to 50%) in air pollution levels in the cities of Karachi, Islamabad, Lahore, Peshawar, Quetta, and more. In this study used low-cost sensor units were used to measure PM2.5 and PM10. These KOALA sensor units have been used in previous research to monitor air pollution, and have been used in several countries by others. For example, the units are used to estimate the traffic-induced PM2.5 in Beijing, China [32], and a network of seven KOALA monitors were used to study ship emission's effect on air quality in Australia [33]. Some previous studies have used small sensor technology to measure air pollution during the COVID19 pandemic. A study by Nadzir et al. [34] using low-cost sensors reported that the PM2.5 levels in Jaya city in Petaling district, Malaysia reduced by 20% to 60% during their lockdown period while data from a network of low-cost Real-time Affordable Multi-Pollutant (RAMP) sensor packages deployed throughout Pittsburgh, Pennsylvania, USA reported that CO and PM2.5 concentrations were lower during the post-lockdown period (March 14th to April 30th, 2020) compared to the period before [35]. The main justification for the lockdown of areas is to control community transmission of the COVID-19. However, recently published studies suggested that particulate matter can create a suitable environment to transmit COVID-19 to greater distances [36], [37]. Therefore, there are indirect benefits to control the disease's spread in lockdown areas where air pollution is high. Further, studies have investigated the impact of reduced air quality during COVID-19 on human health. PM2.5 levels during COVID-19 lockdown decreased across seven states in the United States, and air pollution-related deaths have been estimated to have decreased [38]. Changes in air pollutant levels during the lockdown period were evaluated and assessed the impact of the lockdown on air quality over urban areas in India [39]. The reduced air pollution during the COVID-19 provides a unique opportunity to understand air pollution locally and globally, where this information can be used to mitigate future air pollution.
4. Conclusion
The KOALA sensors were previously validated against reference instruments [15]. Very little work has been done to monitor the ambient air pollution in Sri Lanka's cities due to the lack of standard monitoring facilities, therefore, this provided an excellent opportunity to study how air pollutants vary before and during a lockdown period. PM2.5 and CO reductions were most noticeable in Colombo and Kandy's Urban Background areas, where vehicular traffic represents the major source of these air pollutants. The findings of this study suggest that air pollution is mainly concentrated in urban areas, mostly caused by vehicle emissions and industrial activities. Preliminary analysis of air quality data in the present study indicates that the COVID-19 pandemic lockdown may be considered a 'blessing in disguise' where improved air quality enables the earth to refresh itself. This reduction in air pollution, even if only for a modest duration, may have short-term health benefits such as reduced hospital admissions for respiratory problems, cardiovascular illness, asthma, and premature death. These results can be used to inform Government policy. Minimizing vehicular and industrial pollution will improve air quality in urban areas and help sustain better public health.
Acknowledgments
We would like to acknowledge the Sri Lanka National Science Foundation for providing funds (grant number: RG/2019/BS/01). This study was partially supported by a seed grant from the Australian National Health and Medical Research Council's Centre for Air pollution, energy and health Research (CRE-CAR). Mobitel (Pvt) Ltd, Sri Lanka sponsored to provide data communication facilities.
References
[1] D. Rodríguez-Urrego and L. Rodríguez-Urrego, “Air quality during the COVID-19: PM2.5 analysis in the 50 most polluted capital cities in the world,” Environmental Pollution, vol. 266, p. 115042, 2020, doi: 10.1016/j.envpol.2020.115042. View Article
[2] A. Chauhan and R. P. Singh, “Decline in PM2.5 concentrations over major cities around the world associated with COVID-19,” Environmental Research, vol. 187, p. 109634, 2020, doi: 10.1016/j.envres.2020.109634. View Article
[3] B. M. S. Batagoda, A. G. T. Sugathapala, M.M.S.S.B. Yalegama, and B. S. Jayasinghe, “Urban Air Quality Management in Sri Lanka Urban Air Quality Management in Sri Lanka Urban Air Quality Management,” 2008. Available: View Article
[4] S. Mahato, S. Pal, and K. G. Ghosh, “Effect of lockdown amid COVID-19 pandemic on air quality of the megacity Delhi, India,” Science of the Total Environment, vol. 730, p. 139086, 2020, doi:10.1016/j.scitotenv.2020.139086. View Article
[5] S. Selvam, P. Muthukumar, S. Venkatramanan, P. D. Roy, K. Manikanda Bharath, and K. Jesuraja, “SARS-CoV-2 pandemic lockdown: Effects on air quality in the industrialized Gujarat state of India,” Science of the Total Environment, vol. 737, p. 140391, 2020, doi: 10.1016/j.scitotenv.2020.140391. View Article
[6] L. Y. K. Nakada and R. C. Urban, “COVID-19 pandemic: Impacts on the air quality during the partial lockdown in São Paulo state, Brazil,” Science of the Total Environment, vol. 730, p. 139087, 2020, doi:10.1016/j.scitotenv.2020.139087. View Article
[7] Q. Liu,J. T. Harris, L. S. Chiu, D. Sun, P. R. Houser, M. Yu, D. Q. Duffy, M. M. Little, and C. Yang, “Spatiotemporal impacts of COVID-19 on air pollution in California, USA,” Science of the Total Environment, vol. 750, p. 141592, 2021, doi: 10.1016/j.scitotenv.2020.141592. View Article
[8] X. Lian, J. Huang, R. Huang, C. Liu, L. Wang, and T. Zhang, “Impact of city lockdown on the air quality of COVID-19-hit of Wuhan city,” Science of the Total Environment, vol. 742, p. 140556, 2020, doi: 10.1016/j.scitotenv.2020.140556. View Article
[9] M. H. Masum and S. K. Pal, “Statistical evaluation of selected air quality parameters influenced by COVID-19 lockdown,” Global Journal of Environmental Science and Managment, vol. 6, pp. 85–94, 2020, doi: 10.22034/GJESM.2019.06.SI.08. View Article
[10] M. Sharma, S. Jain, and B. Y. Lamba, “Epigrammatic study on the effect of lockdown amid Covid-19 pandemic on air quality of most polluted cities of Rajasthan (India),” Air Qualily, Atmosphere & Health, vol. 13, no. 10, pp. 1157–1165, 2020, doi: 10.1007/s11869-020-00879-7. View Article
[11] R. P. Singh and A. Chauhan, “Impact of lockdown on air quality in India during COVID-19 pandemic,” Air Qualily, Atmosphere & Health, vol. 13, no. 8, pp. 921–928, 2020, doi: 10.1007/s11869-020-00863-1. View Article
[12] D. Stratoulias and N. Nuthammachot, “Air quality development during the COVID-19 pandemic over a medium-sized urban area in Thailand,” Science of the Total Environment, vol. 746, p. 141320, 2020, doi:10.1016/j.scitotenv.2020.141320. View Article
[13] “Colombo Municipal Council.” View Article
[14] “Kandy Municipal Council.” View Article
[15] X. Liu, R. Jayaratne, P. Thai, T. Kuhn, I. Zing, B. Christensen, R. Lamont, M. Dunbabin, S. Zhu, J. Gao, D. Wainwright, D. Neale, R. Kan, J. Kirkwood, and L. Morawska, “Low-cost sensors as an alternative for long-term air quality monitoring,” Environmental Research, vol. 185, no. March, p. 109438, 2020, doi: 10.1016/j.envres.2020.109438. View Article
[16] “CO-Sensor.” View Article
[17] R. Jayaratne, X. Liu, P. Thai, M. Dunbabin, and L. Morawska, “The influence of humidity on the performance of a low-cost air particle mass sensor and the effect of atmospheric fog,” Atmospheric Measurment Techniques, vol. 11, no. 8, pp. 4883–4890, 2018, doi: 10.5194/amt-11-4883-2018. View Article
[18] K. E. Kelly, J. Whitaker, A. Petty, C. Widmer, A. Dybwad, D. Sleeth, R. Martin, and A. Butterfield, “Ambient and laboratory evaluation of a low-cost particulate matter sensor,” Environmental Pollution, vol. 221, pp. 491–500, 2017, doi: 10.1016/j.envpol.2016.12.039. View Article
[19] L. Sun, K. C. Wong, P. Wei, S. Ye, H. Huang, and F. Yang, “Development and Application of a Next Generation Air Sensor Network for the Hong Kong Marathon 2015 Air Quality Monitoring,” Sensors, vol. 16, no. 2, p. 211, 2015, doi: 10.3390/s16020211. View Article
[20] P. Wei, Z. Ning, S. Ye, L. Sun, F. Yang, K. C. Wong, D. Westerdahl and P. K. K. Louie, “Impact Analysis of Temperature and Humidity Conditions on Electrochemical Sensor Response,” Sensors, vol. 18, no. 2, 2018, doi: 10.3390/s18020059. View Article
[21] Z. Yong and Z. Haoxin, Digital universal particle concentration sensor PMS6003 series data manual Writer, vol. c. 2016, p. 15.
[22] R Core Team (R Foundation for Statistical Computing), “R: A Language and Environment for Statistical Computing,” 2020. View Article
[23] D. Carslaw and K. Ropkins, “Package ‘openair,’” 2020, Available: View Article
[24] M. G. Kendall, Rank correlation methods. London: Griffin, 1948.
[25] P. K. Sen, “Estimates of the Regression Coefficient Based on Kendall’s Tau,” Journal of the American Statistical Association, vol. 63, no. 324, pp. 1379–1389, 1968,. Available: View Article
[26] O. A. Ileperuma, “Review of air pollution studies in Sri Lanka,” Ceylon Journal of Science, vol. 49, no. 3, p. 225, 2020, doi: 10.4038/cjs.v49i3.7773. View Article
[27] “Ministry of Environment Forestry,” 2013. Available: View Article
[28] A. P. Wickramasinghe, D. G. G. P. Karunaratne, and R. Sivakanesan, “PM10-bound polycyclic aromatic hydrocarbons: Concentrations, source characterization and estimating their risk in urban, suburban and rural areas in Kandy, Sri Lanka,” Atmospheric Environment, vol. 45, no. 16, pp. 2642–2650, 2011, doi: 10.1016/j.atmosenv.2011.02.067. View Article
[29] M. Krzyzanowski and A. Cohen, “Update of WHO air quality guidelines,” Air Qualily, Atmosphere & Health, vol. 1, no. 1, pp. 7–13, 2008, doi: 10.1007/s11869-008-0008-9. View Article
[30] H. H. Dang and T. Trinh, “Does the COVID-19 Pandemic Improve Global Air Quality ? New Cross-National Evidence on Its Unintended Consequences,” Journal of Environmental Economics and Managment, 2021, Available: View Article
[31] K. Ahmed Khan, M. Mubbin, I. Haq, and N. Hussain, “Air Quality Index with Particulate Matter (PM2.5) Improved after National Lockdown during COVID-19 Outbreak across Pakistan,” Open Access Journal of Biogeneric Science and Research, vol. 3, no. 2, pp. 3–8, 2020, doi: 10.46718/jbgsr.2020.03.000065. View Article
[32] X. Liu, Q. Zhao, S. Zhu, W. Peng, and L. Yu, “An experimental application of laser-scattering sensor to estimate the traffic-induced PM2.5 in Beijing,” Environmental Monitoring and Assessment, vol. 192, no. 7, 2020, doi: 10.1007/s10661-020-08398-9. View Article
[33] R. Jayaratne, T. Kuhn, B. Christensen, X. Liu, I. Zing, R. Lamont, M. Dunbabin, J. Maddox, G. Fisher and Lidia Morawska, “Using a Network of Low-cost Particle Sensors to Assess the Impact of Ship Emissions on a Residential Community,” Aerosol Air Quality Research, vol. 20, no. 12, pp. 2754–2764, 2020, doi: 10.4209/aaqr.2020.06.0280. View Article
[34] M. S. M. Nadzir , M. S. Mohd, M. C. G. Ooi, K. M. Alhasa, M. A. A. Bakar, A. A. A. Mohtar, M. F. F. M. Nor, M. T. Latif, H. H. A. Hamid, S. H. M. Ali, N. M. Ariff, J. Anuar, F. Ahamad, A. Azhari, N. M. Hanif, M. A. Subhi, M. Othman and M. Z. M. Nor, “The impact of movement control order (MCO) during pandemic COVID-19 on local air quality in an urban area of Klang valley, Malaysia,” Aerosol Air Quality Research, vol. 20, no. 6, pp. 1237–1248, 2020, doi: 10.4209/aaqr.2020.04.0163. View Article
[35] R. Tanzer-Gruener, J. Li, S. R. Eilenberg, A. L. Robinson, and A. A. Presto, “Impacts of Modifiable Factors on Ambient Air Pollution: A Case Study of COVID-19 Shutdowns,” Environmental Science Technology Letters, vol. 7, no. 8, pp. 554–559, 2020, doi: 10.1021/acs.estlett.0c00365. View Article
[36] S. Comunian, D. Dongo, C. Milani, and P. Palestini, “Air pollution and covid-19: The role of particulate matter in the spread and increase of covid-19’s morbidity and mortality,” International Journal of Environmental Research and Public Health, vol. 17, no. 12, pp. 1–22, 2020, doi: 10.3390/ijerph17124487. View Article
[37] L. Setti, F. Passarini, G. D. Gennaro, P. Barbieri, S. Licen, M. G. Perrone, A. Piazzalunga, M. Borelli, J. Palmisani, A. D. Gilio, E. Rizzo, A. Colao, P. Piscitelli and Alessandro Miani, “Potential role of particulate matter in the spreading of COVID-19 in Northern Italy: First observational study based on initial epidemic diffusion,” BMJ Open, vol. 10, no. 9, pp. 1–9, 2020, doi: 10.1136/bmjopen-2020-039338. View Article
[38] J. Y. Son, K. C. Fong, S. Heo, H. Kim, C. C. Lim, and M. L. Bell, “Reductions in mortality resulting from reduced air pollution levels due to COVID-19 mitigation measures,” Science of the Total Environment, vol. 744, p. 141012, 2020, doi: 10.1016/j.scitotenv.2020.141012. View Article
[39] C. Navinya, G. Patidar, and H. C. Phuleria, “Examining effects of the COVID-19 national lockdown on ambient air quality across urban India,” Aerosol Air Quality Research, vol. 20, no. 8, pp. 1759–1771, 2020, doi: 10.4209/aaqr.2020.05.0256. View Article