International Journal of Environmental Pollution and Remediation (IJEPR)
ISSN: 1929-2732

Volume 7 - Year 2019 - Pages 9-22
DOI: 10.11159/ijepr.2019.002
Evaluating Water Quality Indicators of Some Water Sources in the Bitumen-Rich Areas of Ondo State, Nigeria
Eganoosi Esme Atojunere1 and Kolawole Ogedengbe2
1University of Lagos, Department of Systems Engineering
Akoka, Yaba, Lagos, Nigeria
eatojunere@unilag.edu.ng
2University of Ibadan, Department of Agricultural and Environmental Engineering
Oduduwa Road, Ibadan, Nigeria
k.ogedengbe@ui.edu.ng; kolaogedengbe@yahoo.com
Abstract - Contaminated water, sourced from wells and streams has for long remained the major available water for domestic, industrial and some others uses in the bitumen-rich areas of Ondo State, Nigeria. In this work, the effects of bitumen contamination on some of the quality of water from the wells and streams in the area are determined from the water samples taken from the sources. Sample collections are during the successive dry and wet seasons. They are subjected to physico-chemical analyses, using the American Public Health Association (APHA) standard. Water temperatures, pH values, turbidity, electrical conductivities, water hardness, suspended solids (SS), water hardness, toxic metals and presence of hydrocarbons, benzene, toluene, ethylbenzene and xylene (BTEX) in the samples are determined. There are significant differences between the values of the indicators determined during the dry season and the wet season ( α_0.05).Hardness was higher during the dry seasons. The inhabitants of the areas reported increased use of soap for washing during the dry season. Some indicator temperatures, zinc, iron, calcium levels are within the World Health Organization (WHO) and National Environmental Standards Regulatory and Enforcement Agency (NESREA) standards for potable water while others lead, chromium, cadmium, hardness and hydrocarbons are found to be slightly higher. Some quality values for the water collected during the wet and dry seasons were respectively: temperature: 26.25±0.05 to 26.65±0.05; 29.85±0.07 to 30 ±0.05 o C, pH value 5.15±0.04 to 6.80±0.07, 4.49±0.05 to 5.45±1.07, Suspended solids:114.9±38 to 390±10, 50±22.4 to 810.9±10.3,cadmium: 0.542±0.2 to 0.145±0.14,0.234±0.23, hardness of water:730±42.43 to 3100±100, 190±13.13 to 2960±2100mg/L, hydrocarbons for benzene, toluene, ethylbenzene and xylene:6.189±3.98 to 10.1±2.35 µg/L. Strong correlations existed among physical and chemical parameters determined in all the locations S1 to S4 at 95% confidence level. Bitumen accumulations on available water sources might be the source of the level of heavy metals and BTEX recorded, as they are reportedly associated with bitumen. They are potential health risk to the people living in the area.
Keywords: Bitumen, Pollution, Water quality, Potable water.
© Copyright 2019 Authors - This is an Open Access article published under the Creative Commons Attribution License terms. Unrestricted use, distribution, and reproduction in any medium are permitted, provided the original work is properly cited.
Date Received: 2018-04-10
Date Accepted: 2018-11-15
Date Published: 2019-02-14
1. Introduction
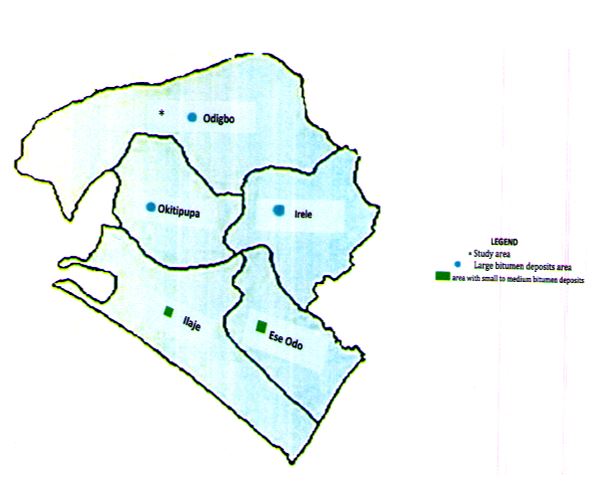
Some bitumen-rich communities in Ondo State are Agbabu, Ilubinrin, Lodasa and Boridele. The major river flowing across these areas has tributaries extending to other villages, rendering them experiencing bitumen pollution in the available water sources. Surrounding lands are also laden with bitumen seepages. Soil, water and atmosphere are adversely affected, and passing these to plants, animals and human beings during nutrient uptake and ingestion along the food chain. Study has found that rivers flowing through bitumen-rich areas are in themselves subjected to heavy pollution due to long contact between bitumen and the water bodies [1]. Some of the reported rivers include Athabasca and Peace River in Canada and Orinoco River in Venezuela and pitch Lake of Trinidad and Tobago. Presence of toxic metals, hydrocarbons and oily solids from as a result of bitumen pollution in those river has been identified. They are responsible for the impairment of water quality of those rivers. Fish in such water has deformities, lesion including bruises and blood stain on the skin of fish taken from such water and ingestion of this contaminated fish by human being could be devastating [2].Such water too is not safe for irrigation as most of the toxic metal are not biodegradable in soil and could be uptake by plant during nutrients exchange in plant. After rainfall, bitumen mats floats on the surfaces of water sources at some bitumen-rich communities of Ondo State. This prevent exchange of dissolved oxygen, a vital indicator of status of the water sources. The indigenes of the bitumen-affected communities depend solely on polluted water sources for domestic consumption, industrial and recreational purposes. Bitumen and its associated constituents could make way to human being through skin contact during use, ingestion of contaminated water and foods. Death of landed migrating birds on tailing pond storing bitumen-polluted water has been reported [3]-[4].The polluted water contained toxic chemicals (cadmium, lead and chromium) that are injurious to health. There is need for urgent monitoring the quality of water in the bitumen-rich areas.
2. Materials and Methods
2.1. Water Sampling and Procedures
Four sampling points are selected within the four farm settlements in Odigbo (06o35 N, 5o E). The criteria of selecting sampling points are population, presences of bitumen deposits and river catchment areas. Water sample as composites samples from well and streams. The sampling points are indicated in Figure 1. Sampling was done twice every month from the month September 2015 to August, 2016, for dry and wet seasons. Samples are collected into sterile screw capped plastic containers. Prior to sample collection, all bottles were washed with dilute nitric acid followed by distilled water and were dried in an oven. Before taking water samples, the bottles are rinsed three times with the water to be collected. The sampling bottles were labelled with dates and sampling source. Collected water samples were stored in a cooler at 4oC.
2.1.1. Collection of Bitumen-Polluted Water Samples from Streams and Wells
Samples of bitumen-polluted water are taken for a dry and wet season from four streams and wells in Odigbo local government Area of Ondo State, Nigeria [5]. The water sources are inside four farm settlements (Table 1) close to their bitumen deposits locations. Major river, River Oluwa supplied water into these waterbodies through different tributaries that later served as water sources for the people living in the area. Wells and streams are spring-fed; most springs are underneath the bitumen deposits in the area. Other areas that contained small to medium level of bitumen deposits in the State are Ilaje, Okitipupa, Irele and Ese Odo as shown in Figure 1.They are within coordinates 6oN 5oE of Ondo State, Nigeria. People living in the area are largely peasant farmers and their mainstay come from cultivation of agricultural crops such as cassava (Manihot esculenta), cocoa (Theobroma cacao) and rubber (Hevea brasilensis) tree and fish farming. Sampling points were chosen close to abandoned drilled bitumen boreholes, which periodically ooze out bitumen to the surface and accumulation of bitumen, are observed at riverbanks and farmlands. Some of the selected wells contained bitumen deposits along with water. Samples are taken in duplicates at different depths as composites samples. At the streams, samples container are held near its bottom and submerged with the mouth facing slightly downwards sampling facing the water current. For dugout wells, a 500-ml weighted container was attached to a pebble about 1- 2 kg and to 20 m length rope. It was rolled around a stick and was tied to the container string and lowered into the well to about 10 to 20cm distance below the water surface by unwinding the string slowly and contact with the sides of the well was avoided. Plastic and glass containers are used to collect water for meant for some heavy metals and hydrocarbons analyses and 2-ml of nitric acid was added to the former to keep available metals in solution during transportation to the laboratory while no preservation to the latter. All samples containers are thoroughly washed, rinsed, dried and labelled before use. Samples collection, preservation, storage and methods of examination of parameters (Table 2) followed standard procedures [6]-[7].
Table 1. Name of sampling sites, and their geographical location in Odigbo, Ondo, Nigeria.
| Sample location and Code | Population | Name of the water sources | Geographic coordinates |
| Ilubirin (S1) | 15,000 | Ilubinrin water sources | 06o38.555, E004o.7411 |
| Agbabu (S2) | 20,000 | Agbabu water sources | 06o36.203, E004o 44.784 |
| Lodasa (S3) | 8,000 | Lodasa water sources | 06o38.300, E004o 49.772 |
| Boridele (S4) | 6,000 | Boridele water sources | 06o36.920, E004o 49.825 |
Table 2. Parameters and methods of examination
| Name of parameter | Instrument used for determination | Method used | Reference |
| Temperature, pH, turbidity, Water conductivity, | Thermometer, pH meter (H196107) , turbidimeter (HACH 2100N) and conductivity meter(MC126) | In-situ measurements by direct insertion of meter(s) probes in the samples | [7] |
| Ca2+,mg2+,,Zn2+,,Cu,Fe,Cd,Cr,Pb,Ni. | Atomic Absorption Spectrophotometer | Digestion followed by analysis in AAS. A Analyst 200 PerkinElmer | [7] |
| Hardness, Acidity, Akalinity | Titration | Titration | [7] |
| SO42-,PO42-,NO32- Cl-, | Titration | Titration | [7] |
| BTEX | Gas Chromatograph GC 6890N / Mass Spectrometer,5975C, Agilent Technologies | Solvent extraction followed by analysis | [7] |
2.2. Physico-chemical Analysis of Bitumen-Polluted Water Samples
Twenty-six (26) water pollution indicators are determined in the samples taken from bitumen affected streams and wells during dry and the wet seasons(Table 3).They are water temperature, pH value, turbidity, water conductivity, suspended solids, alkalinity, acidity, water hardness, presence of calcium, magnesium, sulphate, phosphate, chloride, nitrates, zinc, iron, lead, cadmium, copper, nickel, chromium, Benzene, Toluene, Ethylbenzene, o-Xylene and p-Xylene(BTEX). Some physical parameters of water turbidity, temperatures and pH values are determined in-situ to avoid change in measurements. These are carried out using portable turbidmeter, a mercury in glass thermometer and pH meter respectively. BTEX test followed solvent extractions in vial bottles of the samples with n-hexane in Gas chromatography/ mass spectrometer of Agilent Technologies, 6890N and 5975C respectively. Calibration of GC/MC was carried out using BTEX standards (hexadecane extraction volatiles (CLP-BTEX-10X-PAK) containing 2.0 mg/m BTEX in methanol (MeOH) from AccuStandard, company United States of America.
2.2.1. Determination of Heavy Metals in the Bitumen-Polluted Water (BPW)
100ml of each sample was digested with 10ml of nitric acid and was boiled inside a flask using electric stove for 2 hours and the blank samples are prepared. The sample flask was air-cooled and samples are filtered. The digested water samples are tested for the levels of metals: Cd, Mg, Zn, Pb, Ni, Cu, Fe, Mg, Ca and Cr using the Atomic Absorption Spectrophotometer (AAS) of PerkinElmer AAnalyst 200 model, at the Department of Chemistry, University of Lagos, Nigeria. A standard of 20ml each metals was prepared for the AAS calibration. Digestion was done by addition of concentrated nitric acid (5 ml) to 50 mL of each sample of water in a 100 mL beaker. The mixture was heated on a hot plate to boil until its volume reduced to 20 mL. Another 5 mL of concentrated nitric acid was added and then heated for another 10 minutes and allowed to cool. About 5 mL of nitric acid was used to rinse the sides of the beaker; the solution was quantitatively transferred into a 50 mL volumetric flask and made up to the mark with distilled water. A blank solution was similarly prepared. Calibration curves are drawn for each metal by running suitable concentrations of their standard solutions from which the concentrations of the elements obtained by extrapolation. Average values of three replicates are taken for each determination. The absorbance of the blank was taken before the analysis of the samples. The concentration of each element was determined using the AAS and steps were repeated for 3 times.
2.2.2 Statistical Analyses
Statistical analysis of the results are carried out using both Microsoft Excel (2003 Edition) and STATA software to produced charts. The relationships between the indicators concentrations the samples per site are evaluated by linear regression and the determination of Pearson correlation coefficients. All errors are calculated at 95% confidence level.
3. Results and Discussions
The ranges, means and standard deviations and correlations obtained from all parameters determined from the bitumen-polluted water samples are summarized in Tables 3 and 4-7 respectively. Bar charts of relative heights of the parameters from the sample locations for dry and wet seasons are presented in Figures 2 and 3.
Table 3. Range, mean, standard deviation of average data from physico-chemical analysis of water at study area for dry and wet seasons.
| Parameters Range, Mean +SD | *WS1 w | WS1 d | WS2 w | WS2 d | WS3 w | WS3 d | WS4 w | WS4 d | [9] NESREA |
[10] WHO |
| TemperatureoC | 26.4-26.6, 26.45±0.07 | 29-31. 30±0.14 | 26.4-26.5,26.45±0.05 | 29.7-29.8, 29.75±0.05 | 26.6-26.7, 26.65±0.05 | 29.8-30.2, 30±0.2 | 26.2-26.3, 26.25±0.1 | 29.8-29.9, 29.85±0.07 | 27-33 | 27-33 |
| pH1value | 6.37-6.7, 6.42±0.07 | 5.18-5.5, 5.34±0.23 | 5.9-6± 5.95±0.05 | 4.38-6.52, 5.45±1.07 | 6.5-6.6, 6.65±0.15 | 4.38-4.61, 4.495±0.115 | 5.12-5.18, 5.15±.0.04 | 5.09-5.165,5.15±0.10.07 | 6.5-8.5 | 6.5-8.5 |
| Turbidity NTU | 12.5-15, 13.7±1.77 | 3.17-3.53, 3.53±0.25 | 9.8-10± 9.9±0.1 | 5.83-6.27, 6.05±0.22 | 8-10, 9±1 | 10.9-12.6, 11.75±0.85 | 4-9, 6.5±3.5 | 1.47-1.76, 1.615±0.20 | 5.0 | 20-30 |
| Water conductivity 2(µS/cm) | 343-401,372±40.02 | 610.54-708.5, 659.52±69.3 | 100.4-103± 101.7±1.3 | 565.46-2489.2, 1527.33±961.87 | 80-90.5, 85.25±5.25 | 1607.54-1636.6 1622.07±14.53 | 17.6-28.32,22.96±7.6 | 132.3-774.2, 453.25±453.9 | 1000 | 1000 |
| Alkalinity mg/L | 60-65,62.5±3.54 | 100-250, 175±106.06 | 69-70, 69.5±0.5 | 125-575, 350±225 | 75-80, 77.5±2.5 | 125-525, 325±200 | 100-283.2,191.61±129.6 | 75-200, 137.5±88.4 | 2-200mg/L | 2-200mg/L |
| Acidity mg/L | 50-60,55±7.07 | 74-75, 74.5±0.71 | 55-60, 60.57.5±2.5 | 60-75, 67.5±7.5 | 60-75, 67.5±7.5 | 50-70, 60±10 | 100-130, 115±21.2 | 50-75, 62.5±17.7 | 200 | 20-300 |
| 4Water hardness mg/L | 700-760, 730±42.43 | 115-345, 230±162.6 | 2500-2500,2550±50 | 110-320, 215±105 | 110-320, 215±105 | 2750-3170, 2960±210 | 900-1000, 950±70.71 | 110-270, 190±113.13 | 500mg/L | 500mg/L |
| Nickel mg/L | 0-0.005±0.01 | 0 | 3.556-7.824,5.69±2.134 | 3.61-5.708, 4.659±1.049 | 0 | 0-0.001, 0.0005±0.005 | 0-1.59. 0.79±1.1 | 0.001-0.892, 0.4465±0.63 | 0.7mg/L | 0.7mg/L |
| Cr5.mg/L | 0-0.02, 0.01±0.014 | 0.04-0.07, 0.06±0.02 | 0.23-0.065, 0.1475±0.0825 | 0-0.142, 0.071±0.071 | 0.05-0.55, 0.3±0.25 | 0 | 0-0.12, 0.06±0.08 | 0.002-0.04, 0.021±0.02 | 0.02 | 0.02 |
| Lead5mg/L | 0.014-0.06,0.037±0.03 | 0 | 0 | 0 | 0 | 0-0.01, 0.005±0.05 | 0 | 0-0.01, 0.05±0.01 | 0,05mg/L | 0.05mg/L |
| Cd5 mg/L | 0.391-0.657,0.524±0.2 | 0.362-0.148, 0.148±0.15 | 0.473-0.006± 0.2395±0.2335 | 0.002-0.004, 0.003±0.001 | 0-0.391, 0.1955±0.2 | 0.287-0.002, 0.1445±0.1425 | 0-0.466, 0.023±0.33 | 0-0.233, 0.113±0.17 | 0.03mg/L | 0.03mg/L |
| Zinc mg/L | 2.064-3.267, 2.67±0.85 | 0.27-0.68, 0.475±0.3 | 0.55-3.256± 1.903±1.353 | 0.044-0.14, 0.092±0.048 | 0-2.991, 1.4955±1.5 | 0.13-0.47, 0.3± 0.17 | 0-1.725. 0.86±1.22 | 0.09-0.78. 0.435±0.5 | 3mg/L | 3mg/L |
| Iron mg/L | 0-0.261,0.1305±0.85 | 0.022-0.196, 0.196±0.12 | 0.038-0.11± 0.074±0.036 | 0.036-0.201, 0.1185±0.0825 | 0-0.192, 0.096±0.1 | 0.034-0.087 ,0.06±0.3 | ND | 0-1.908,0.954±1.35 | 0.3mg/L | 0.3mg/L |
| Phosphate mg/L | 10-12.2,11.1±1.55 | 20.8-27.1, 23.95±4.43 | 10-13,11.5±1.5 | 18.9-40.5, 29.7±10.8 | 8.94-10, 9.47±0.53 | 17.6-43.2, 30.4±12.8 | 10.7-25.1, 17.9±10.2 | 17.6-27.9, 22.8±7.3 | 0.1mg/L | 0.1mg/L |
| Nitrate mg/L | 30-33.8,33.3±2.3 | 45.5-37.2, 41.35±5.83 | 37.36-38, 37.68±0.32 | 44.2-46.8, 45.5±1.3 | 26.2-64.5, 45.35±19.2 | 30.12-80.86, 55±25.4 | 8.8-39.2, 24±21.5 | 16-36.5, 26.25±14.5 | 50mg/L | 50mg/L |
| Sulphate mg/L | 350-675, 512±229.81 | 68-156, 112±62.2 | 140-160,150±10 | 112-168, 140±28 | 120-300, 210±90 | 210-250, 230±20 | 105-130, 117.5±17.7 | 76-140, 108±45.25 | <250mg/L | <250mg/L |
| Chloride mg/L | 194.98-196.9, 195.94±1.36 | 88.63-106.35,97±12.5 | 200-201 200.5±0.5 | 301.33-850, 575.665±274.335 | 190-195,192.5±2.5 | 1300-1470, 1385±85 | 141-283.2,212.5±99.9 | 41.8-70.4, 56.1±20.22 | 250mg/L | 250mg/L |
| Copper mg/L | 0-0.002,0.001±0.014 | 0.006 -0.05,0028±0.03 | 0.019-0.002-7,0.013±0.06 | 0.023-0.005,0.014±0.009 | 0.031-0.006, 0.0185±0.01 | 0.008-0.0013, 0.005±0.003 | 0 | 0-0.006.0.002±0.004 | 2mg/L | 2mg/L |
| Calcium mg/L | 292.58-350,321.38±40.60 | 46.09-138.28 92.185±65.3 | 1300-1850± 1575±275 | 44.09-128.26, 86.2±42.1 | 1500-1700, 1600±100 | 1102.2-1270.54, 1186.4±84.2 | 88.3-141.61, 114.9±37.7 | 38.47-66.15, 52.3±19.6 | 75mg/L | 75mg/L |
| Suspended solid 3 mg/L | 171-200,185±19.8 | 803.68-818.3, 810.95±10.3 | 250-300, 275±25 | 282.73-1244.6, 763.7±480.9 | 380-400, 390±10 | 305.3-354.3, 329.8±24.5 | 88.3-141.61, 114.9±37.7 | 34.47-66.15, 50±22.4 | 40mg/L | 40mg/L |
| Magnesium mg/L | 106.3-150.4,128.35±31.2 | 16.75-50.23, 33.49±23.3 | 1007-1230,1118.5±111.5 | 44.07-46.59. 45.33±1.26 | 950-1400, 1175±225 | 400.42-461.57, 430.9±30.58 | 364-467.4, 415.7±73.1 | 39.31-46.02, 42.67±4.74 | <30mg/L | <30mg/L |
| Benzene6 µg/L | 3.378-9, 6.189±3.98 | 8.406-11.735, 10.1±2.35 | 3.378-9, 6.189±2.811 | 8.406-11.735, 10.07±1.67 | 3.378-9, 6.189±2.81 | 8.406-11.735, 10.07±1.67 | 3.378-9, 6.189±2.81 | 8.406-11.735, 10.07±2.35 | 0.1mg/L | 0.007mg/L |
| Toluene6 µg/L | 3.378-9, 6.189±3.98 | 8.406-11.735, 10.1±2.35 | 3.378-9, 6.189±2.811 | 8.406-11.735, 10.07±1.67 | 3.378-9, 6.189±2.82 | 8.406-11.735, 10.07±1.67 | 3.378-9, 6.189±2.81 | 8.406-11.735, 10.07±2.35 | 0.7mg/L | 0.007mg/L |
| Ethylbenzene6 µg/L | 3.378-9, 6.189±3.98 | 8.406-11.735, 10.1±2.35 | 3.378-9, 6.189±2.811 | 8.406-11.735, 10.07±1.67 | 3.378-9, 6.189±2.81 | 8.406-11.735, 10.07±1.67 | 3.378-9, 6.189±2.81 | 8.406-11.735, 10.07±2.35 | 0.3mg/L | 0.007mg/L |
| o-xylene6 µg/L | 3.378-9, 6.189±3.98 | 8.406-11.735, 10.1±2.35 | 3.378-9, 6.189±2.811 | 8.406-11.735, 10.07±1.67 | 3.378-9, 6.189±2.80 | 8.406-11.735, 10.07±1.67 | 3.378-9, 6.189±2.81 | 8.406-11.735, 10.07±2.35 | 0.5mg/L | 0.007mg/L |
| p-xylene6 µg/L | 3.378-9, 6.189±3.98 | 8.406-11.735, 10.1±2.35 | 3.378-9, 6.189±2.811 | 8.406-11.735, 10.07±1.67 | 3.378-9, 6.189±2.79 | 8.406-11.735, 10.07±1.67 | 3.378-9, 6.189±2.81 | 8.406-11.735, 10.07±2.35 | 0.5mg/L | 0.007mg/L |
Notes on Table 3:Water source at Ilubinrin at wet season and dry season are represented as (WS1w) and (WS1d), water source at Agbabu at wet season (WS2 w), water source at Agbabu at wet season (WS2d), water source at Lodasa at wet season (WS3 w), water source at Lodasa at dry season (WS3 d), water source at Boridele at wet season( WS4 w) and water source at Boridele at dry season (WS4 d). **Some water Pollution parameters that indicated acceptable (other parameters except 1-6), slightly water pollution (3 to 4) and polluted water(2,5 to 6) as represented below: 1 for Suspended solids, 2 for Water conductivity, 3 for pH values, 4 for water hardness, 5 for Heavy metals(pb, cd and cr etc.) and 6 for Hydrocarbons.
3.1. pH Values and Temperatures
The temperatures values of the water sources for wet and dry seasons are S1:26.6±0.07oC,30±0.14oC, S2:26.45±0.05 oC,29.75±0.05 oC,S3:26.65±0.05 oC,30±0.2 oC and S4:26.25±0.1 oC 29.85±0.07 oC. They are within ambient temperatures for the region, cool and considered normal. Cool water is generally more palatable than warm water. The area has large vegetation covers from trees acting like shield. pH values(Table 3) of all water sources are slightly acidic except at S1 and S3 at wet season that are moving towards alkaline. Least value was 5.15 while the highest was 6.65, and water sources with the pH 5.15 are acidic who could be injurious to health of human being, causing corrosion in water supply pipes and rendering aquatic environment unconducive. Water sources especially at Ilubinrin and Lodasa met the minimal World Health Organisation (WHO) and National Environmental Standards Regulatory and Enforcement Agency (NESREA) standard at wet seasons. Dilution of water with might be responsible for the low pH value and the pH values other water sources need to be raised to permissible value. Acid in water might be from runoff form surrounding land might wash away minerals associated with bitumen found in the area. While low pH is undesirable high alkalinity may imparts a bitter taste to the water and render it unfit for human consumption. There was strong correlation with temperatures, turbidity and conductivities at 1.000, 0.873 and 1.000 respectively.
3.2. Turbidity Values and Water Conductivities
The turbidity of S1 to S4 at both seasons are respectively: 13.7±1.77, 3.53±0.25, 9.9±0.1, 6.05±0.22, 9±1, 11.75±0.85, 6.5±3.5, 1.76±1.61. Though, the turbidity value are not high as one expected from those water sources laden with bitumen, it reduced with their water levels. All the turbidity values are higher than the greater than 5 NTU standard for potable water except at Boridele and Ilubinrin recording 3.53±0.25, and 1.615±0.20 at dry season. The Low values might be connected to low disturbances from rain, few persons wading through water, washing clothes, doing recreational activities, bathing using soap in water. Excessive turbidity, or cloudiness, in drinking water is aesthetically unappealing. Reverse trend was recorded conductivities as more ions become free and concentrated during dry season. As conductivities increases the lower the turbidity. Bitumen is an immiscible liquid and take longer time to dissolve in water so its presence does not have significant effects on the turbidity of water. During a rainstorm, particles from the surrounding land are washed into the river-increased turbidity but water velocities at this time are faster and water volumes are higher that quickly transported bitumen materials and other suspend material away from the water surface. Electrical conductivity (EC) is the numerical expression of an aqueous solution to carry electrical current and is useful indicator of the mineralization in a water sample. The least EC value of 17.6 µS/cm was obtained for the S4 samples; while the highest EC of 2489.2 µS/cm was obtained for the S2 samples at dry season. The ECs for these water sources ranged from 17.6-28.32 to 565.46-2489.2, with a mean and standard deviations of 32.22±7.6 and 1527.33±961.87 (Table 3). The WHO limit for EC for potable water was 1000 µS/cm. At dry season the EC values are in this order S3 > S2 > S1 > S4. S2 and S3 at dry season are above the WHO standard while others EC values 372±40.02, 101.7±1.3, 85.25±5.25,22. 96±7.6 and 453.25±453.9 are below the permissible. The high Ec values above permissible rendered them not potable at this time. EC values fluctuations may be due to dilution of water bodies, which in turn increases their volume. Based on high EC, the water sources might not be suitable for domestic use without treatment. Health effects in humans for consuming water with high EC may include disturbances of salt and water balance, and adverse effect on certain myocardic patients and individuals with high blood pressure.
3.3. Suspended Solids
The highest SS mg/L value was recorded 282.73-1244.6, 763.7±480.9 at S2 while the least of 34.47-66.15, 50±22 The trend of increase suspended solids at dry seasons was recorded. This might suggest that the suspended materials are the accumulated bitumen deposits which are afloat on the water surface due to their less density and that the flow rate at low peak are lowered. Others values of SS are presented in Table 3. The water sources are polluted because only the SS mg/L(34.47-66.15, 50±22 ) at Boridele water sources meet the WHO and NESREA standard of 75mg/L for portable water. From Tables 5 and 6, there was strong correlation of SSmg/L in all the water sources for dry and wet seasons at 1.000. This findings suggest that groundwater supposedly safe by water user as soil surface serves as filter, may not be as groundwater pollution caused by unrestrained pollutants is feasible in the area. Water sources (S1 to S4) with SS values >100mg/L >278mg/L >278mg/L are slightly polluted, polluted and strongly polluted.
3.4. Nitrates, Phosphates, Sulphates, and Chlorides
Sulphates, chlorides, phosphates and nitrates salts are presents at different level in allthe water sources (Table 3).There are Correlation among them at both seasons. These salts are found naturally in water but excess amount of chlorides as reported rendered the water unsafe without further treatments. The use of fertilizers, pesticides by farmers for crop protection in the area might be the sources of these salts and detergent for washing and bathing may be souse of phosphate in water. High level of sulphates, chlorides, phosphates and nitrates ions may be inimical to the health of the people in the area. Chlorides concentration ranging from 200-300mg/L may give salty taste to the water detectable through taste but there are no serious health risks.
3.5. Copper, Zinc, Calcium, Magnesium, Iron, and Nickel
From Table 3, there was presence of trace elements: copper, zinc, calcium, magnesium ,iron, and nickel in all the S1,S2,S3 and S4 at dry and wet seasons except nickel which was only detected at S1,S3 during dry season and wet season. The trace elements irons, calcium and magnesium in small quantities as found in the water sources may be useful and good for human health because they are needed in certain amount, however, the presence of these elements in large quantity above permissible will render water less suitable for human consumption. From Tables 4 to 5, there are correlation among all the trace elements detected.This may suggest that likelihood that one is present so the others. Variation in Nickel level does not suggest that those water sources where it was not detected are safe for human consumption but may indicate at this period there was less pollution by nickel and with treatment; the water could be made ready for other use. No pollution by nickel just indicating that there is variation in pollution along the watercourse. For example, the excess concentration of iron in the water may cause discoloration of clothes during washing in such water. Magnesium(mg/L) values found in S1 to S4 ranged from 106.3-150.4, 16.75-50.23,1007-1230, 44.07-46.59,950-1400,400.42-461.57,364-467.4, 39.31-46.02 and for calcium:292.58-350,46.09-138.28,1300-1850,44.09-128.26,1500-1700, 1102.2-1270.54, 88.3-141.61, 38.47-66.15.Ca2+ and Mg2+have no adverse health effects but may explain the high water hardness values recorded and need for excess soap for cleaning experienced by the people living in the bitumen-rich area. This also applied to the Level of Zn, Fe and Cu recorded .though found within acceptable limit, they might pose no serious health concerns however, and excess values may cause staining in laundry and sanitary wares. Zn2+ imparts an undesirable taste to water at threshold of 4mg/L.
3.6. Water Hardness
All hardness level in all the water sources recorded are above the WHO and NESREA standard for potable water except at dry season at S2:110-320,215±105 >S1:230±162.6>S4:110-270,190±113.13. There was correlation between hardness values from S1 to S4 as shown in table 3 and 4. Less hardness was also recorded at dry season suggesting that at dry season the water sources are relatively safe for other uses. Water sources from Ilubinrin and Boridele may suggests that simple water treatments, such as boiling, sedimentation and chlorination, would, to some degree, improved the quality of water from the sources. High hardness was connected to the increase in quantity of soap required in washing as reported by the inhabitants of the bitumen-affected areas.The inhabitants of the also mentioned about the peculiar taste in the water and wastage of soap for especially laundry work during wet season. Upon a concentration more than 500 mg/L water starts to have unpleasant taste. Water with high hardness is not suitable for industrial usage, especially in steam boilers due to the production of precipitates. For industrial purposes, hardness in boiler feed water may lead to scale formation in tubes and drums. This may affect industries within the area that use steam boilers. Precipitates formed by hard water with soap adhered to the surface of tubs, sinks, and dishwasher, and may stain clothes and plates.
3.7. Lead
Lead was found at Ilubinrin, 0.037±0.03 at wet season, Lodasa 0.005±0.05 at dry season and Boridele 0.05±0.01 dry seasons only (Table 3). No Pb was detected in other locations during at both season. Lead is one of the heavy metals that have adverse health implication due to its persistency, toxicity and bioaccumulative effect in human beings and animals after ingestion of contaminated water and derived foods. Variation in locations along the water sources may be due to acidic pH that keep lead metal in solution as the water downstream and flow characteristics including water velocity that prevented precipitation. It increases in human being organs such as kidney and liver and has the potential to causing cancer and death of victims. Lead has been reportedly found in leaf vegetables and some fruits samples taken from popular markets, in Lagos, Nigeria[11]. Lagos is an industrial city where most industrial waste waters end in stream and canal used for farm irrigation. Reports of outbreak of ailments due to lead poisonings, resulting from ingestion of lead-polluted water in Northern Nigeria had been reported[12]. Lead built up in blood of affected people, mostly children that play outdoor and many lives were lost. Lead was from illegal mining of ore gold in the mineral-rich area, which unknowing to them was laden with lead. The detection of lead in the water sources at the bitumen-rich areas indicate serious problems for water, soil, plant, animals and human beings. Pathways of lead to people in the area are inhalation of lead-contaminated air, body contact with bitumen, bitumen polluted water and ingestion of contaminated water and seafood.
3.7.1. Chromium
Chromium was another of the heavy metals found in all the water that raised public health concern to the people living in the area. The means and standard deviations of Cr values are respectively: 0.01±0.01, 0.06±0.020,0.230±0.065,0.1475±0.0825,0.071±0.071, 0.3±0.25, 0.06±0.08, 0.021±0.02. Cr is a toxic metal commonly existing in two chemical states namely chromium III and chromium VI where the latter is the very harmful[13]. This water is not safe for human consumption based on the level of Cr determined. Like, lead and cadmium, Cr is non-biodegradable, has significant biological benefits, event at low concentration in the water, it can increase in concentration after ingestion by human beings. Previous works corroborated these findings[14] - [15], so water drawn from the water sources should be treated before use. The source of cr might be the presence of bitumen deposits in the area because cr is one of the associated impurities found in bitumen. There is strong correction between cr and other heavy metal detected at both season from S1 to S4 as shown in Table 5 and 6 respectively. Ingestion of chromium can lead to are irritants and ulcers in the stomach and small intestine and anemia, Also, sensitivity to cr by allergic reactions such as swelling of the skin has been reported[16]. This may likely be a problem in the bitumen-rich area as possible pollutant pathway to them through skin contact as people living in the area reportedly use bitumen as adhesive, sealants, paints without safety measures.
3.7.2. Cadmium
Cadmium was detected in all the water sources at both seasons. The ranges, mean and standard deviations are 0.391-0.657, 0.524±0.2, 0.362-0.148, 0.148±0.15, 0.473-0.006,0.2395±0.2335,0.002-0.004,0.003±0.001,0-0.391, 0.1955±0.2,0.287-0.002,0.1445±0.1425,0-0.466,0.023 ±0.33,0-0.233, 0.113±0.17.Cadmium,like lead and cr are heavy metal of public concerns[14], it presence indicate pollution of water and with negative effects of the quality of water rendering it unfit for use without further treatment. The highest concentration was 0.657 mg/L, and for least value of 0.391 mg/L. They were variations in the level of cr present per seasons may be due to flow rate of water. There is correlation among cr, cd and pb as shown in Tables 4 and 5 which is an indication their common source and in this case bitumen deposits. Water sources under study are ephemeral and rain control the volumes of water in them dry seasons than wet season. Cadmium poisoning of rice named the itai-itai disease is well known. Due to the cadmium poisoning, the fish in the river started to die, and the rice irrigated with river water did not grow well. The cadmium and other heavy metals accumulated at the bottom of the river and in the water of the river [17].This water was then used to irrigate the rice fields. The riceabsorbed heavy metals, especially the cadmium. Lethal cases are reported when cadmium accumulated in the people eating contaminated rice[18]-[20].Similar outbreak might be in the offing if mitigation measures are not put in place, as level that was determined in the water can increase if presents in sea foods and leafy vegetables harmful for human being and animals during ingestion.
3.8. Hydrocarbons
Hydrocarbons (BTEX) are detected in all the water sources for wet and dry seasons are as shown Table 3. The range, mean, and standard deviation are for benzene, ethylbenzene, toluene, o-xylene and p-xylene respectively: 6.189±3.98, 10.1±2.35, 6.189±2.811,10.07±1.67, 6.189±2.79, 10.07±1.67, 6.189±2.81, 10.07±2.35. Variations in values are might be due to dilution by rain. These values are below permissible by WHO and NESREA. However, it does not suggest that the water drawn from the sources are potable because at lower concentration these pollutants are inimical to human health, as they affect the acceptability of water. Low threshold values of 0.024 to 0.17mg/L for toluene, and 0.02 to 1.8mg/L for xylene has been reportedly causing impairment of taste and odour to quality of water. These threshold are below their health-based guideline values of 0.7 and 0.5mg/L BTEX by WHO. They should not be allowed in potable water because they are priority pollutants on the undesirable contaminants in water supply by United State Environmental Pollution Agency (USEPA). Previous works have reported [21] - [23] negative effects of BTEX increasing in aquatic animals especially fish which are source of protein to human beings. BTEX rarely occur freely in nature but their presence are always in connection with parent hydrocarbons compound such as crude petroleum and petroleum products. [24] - [25]. For this work, their presence in the water tested confirmed that their sources was from the bitumen deposit in the area. Also, there was no knowledge of cottage industries in the area that that generating wastes of such in the area. Based on Heavy metals (Cr,Pb,Cd and Ni.) and BTEX values, the water sources from bitumen-rich area are polluted and continuous monitoring of the quality of water and preferred treatments are advocated. Correlations among the water pollution indices are shown in Tables 4-7.
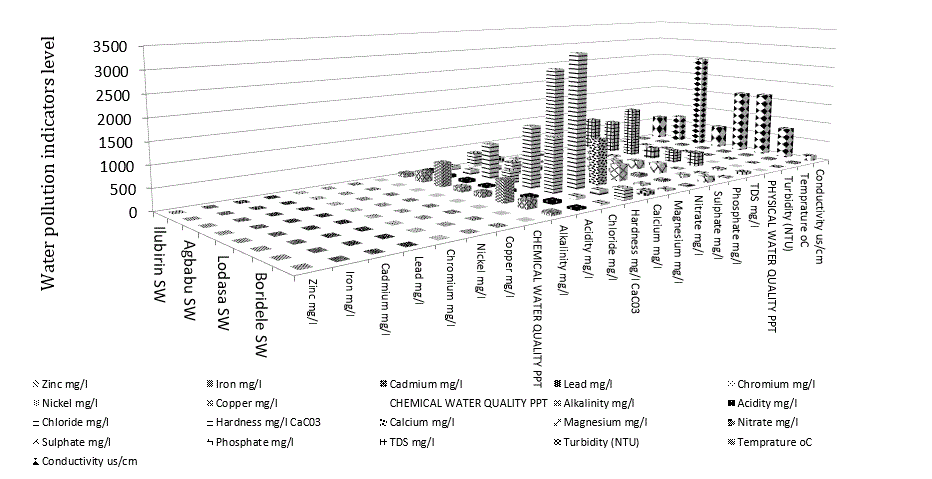
Table 4. Correlation between heavy metals value for wet season from S1, S2, S3, and S4.
| Zinc mg/L | Iron mg/L | Cadmium mg/L | Lead mg/L | Copper mg/L | Nickel mg/L | Chromium mg/L | |
| Zinc mg/L | 1.0000 | ||||||
| Iron mg/L | 0.4453 | 1.0000 | |||||
| Cadmium mg/L | - 0.4890 | 0.0594 | 1.0000 | ||||
| Lead mg/L | 0.1376 | 0.6287 | 0.6330 | 1.0000 | |||
| Copper mg/L | - 0.3417 | - 0.1548 | 0.0975 | - 0.3226 | 1.0000 | ||
| Nickel mg/L | 0.1377 | 0.0106 | - 0.2741 | - 0.3334 | 0.4939 | 1.0000 | |
| Chromium mg/L | - 0.2371 | - 0.0804 | 0.0622 | - 0.2870 | 0.9380 | 0.6604 | 1.0000 |
Table 5. Correlation between heavy metals value for dry season from S1, S2, S3, and S4.
| Zinc mg/L | Iron mg/L | Cadmium mg/L | Lead mg/L | Copper mg/L | Nickel mg/L | Chromium mg/L | |
| Zinc mg/L | 1.0000 | ||||||
| Iron mg/L | - 0.3812 | 1.0000 | |||||
| Cadmium mg/L | 0.0250 | 0.2492 | 1.0000 | ||||
| Lead mg/L | - 0.3374 | 0.9932 | 0.2804 | 1.0000 | |||
| Copper mg/L | - 0.3492 | - 0.2694 | 0.2324 | - 0.2711 | 1.0000 | ||
| Nickel mg/L | - 0.3837 | - 0.1895 | - 0.5690 | - 0.2345 | 0.0361 | 1.0000 | |
| Chromium mg/L | - 0.0504 | - 0.2269 | - 0.4846 | - 0.2990 | 0.0238 | 0.7957 | 1.0000 |
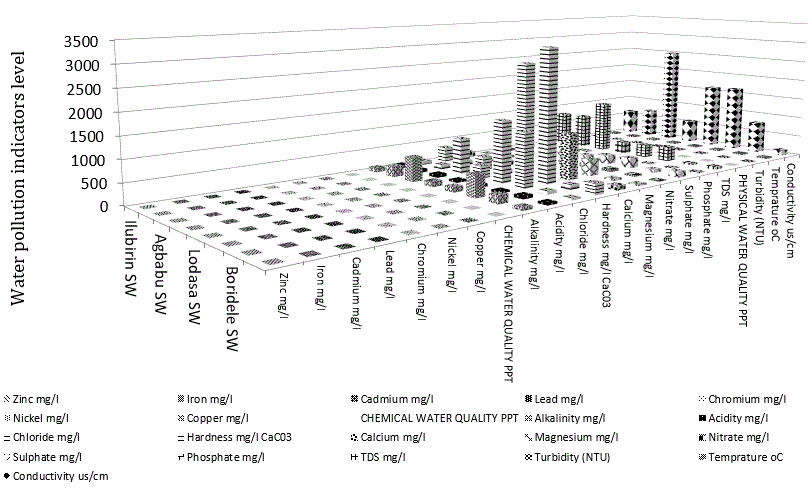
Table 6. *Correlation between the chemical parameters (mg/L) values for wet season from S1, S2, S3 and S4.
| Parameter | Alkalinity | Acidity | Cl-, | Hardness mg/L | Calcium | Mg2+ | SO42- | PO42- | NO32- | SS |
| Alkalinity mg/L | 1.0000 | |||||||||
| Acidity mg/L | 0.0582 | 1.0000 | ||||||||
| Chloride mg/L | 0.4951 | -0.1180 | 1.0000 | |||||||
| Hardness mg/L | 0.3057 | - 0.2723 | 0.8908 | 1.0000 | ||||||
| Calcium mg/L | 0.2099 | - 0.1975 | 0.9042 | 0.9846 | 1.0000 | |||||
| Magnesium mg/L | 0.2112 | - 0.2225 | 0.9021 | 0.9759 | 0.9917 | 1.0000 | ||||
| Nitrate mg/L | 0.2207 | 0.0758 | 0.8617 | 0.8089 | 0.8484 | 0.8514 | 1.0000 | |||
| Sulphate mg/L | 0.5609 | - 0.3264 | 0.8457 | 0.8219 | 0.7921 | 0.8085 | 0.5723 | 1.0000 | ||
| Phosphate mg/L | 0.1452 | 0.3470 | 0.4915 | 0.1909 | 0.3087 | 0.2891 | 0.3083 | 0.3957 | 1.0000 | |
| SS mg/L | 0.5289 | 0.5392 | 0.0845 | - 0.1928 | - 0.1982 | - 0.2440 | 0.0607 | 0.0574 | 0.4010 | 1.0000 |
Table 7. *Correlation between the chemical parameters (mg/L) values for wet season from S1, S2, S3 and S4.
| Parameter | Alkalinity | Acidity | Cl-, | Hardness mg/L | Calcium | Mg2+ | SO42- | PO42- | NO32- | SS |
| Alkalinity mg/L | 1.0000 | |||||||||
| Acidity mg/L | 0.4968 | 1.0000 | ||||||||
| Chloride mg/L | 0.7844 | - 0.1343 | 1.0000 | |||||||
| Hardness mg/L | - 0.2974 | - 0.2244 | - 0.0815 | 1.0000 | ||||||
| Calcium mg/L | - 0.2918 | - 0.2846 | - 0.0499 | 0.9642 | 1.0000 | |||||
| Magnesium mg/L | - 0.1805 | - 0.1492 | - 0.0234 | 0.9253 | 0.8790 | 1.0000 | ||||
| Sulphate mg/L | - 0.3354 | - 0.5218 | - 0.0584 | - 0.3924 | - 0.4088 | - 0.5729 | 1.0000 | |||
| Phosphate mg/L | - 0.0134 | 0.7193 | - 0.5840 | - 0.4152 | - 0.4307 | - 0.2940 | - 0.2245 | 1.0000 | ||
| Nitrate mg/L | 0.2183 | - 0.7117 | 0.7497 | 0.1762 | 0.2443 | 0.2335 | 0.1422 | - 0.7917 | 1.0000 | |
| SS mg/L | - 0.5520 | - 0.3446 | - 0.2889 | 0.8969 | 0.7948 | 0.7975 | - 0.1356 | - 0.4219 | 0.0579 | 1.0000 |
*Correlation is significant at the 0.05 level.
4. Conclusion
Available water sources S1 to S4 in the bitumen-rich area of Ondo State, Nigeria are found polluted based on level of heavy metals and hydrocarbon determined. These pollutants are of public health concerns above permissible of WHO and NESREA. Toxic metals and hydrocarbons are found at different concentrations: lead at dry season only 0.037±0.03,0.005±0.05, 0.05±0.01; cadmium at all locations and both seasons, chromium (0.065 to 0.142; 0.04 to 0.55 mg/L and hydrocarbons: 6.189±3.98, 10.1±2.35,6.189±2.811,for dry and wet season respectively. Some pollutions indicators are higher in dry season than wet season due to rain. There are strong correlation between the pollution parameters of these water sources and the unexploited bitumen resources in the area. These pollutants are undesirable to human being at values exceeding acceptable for drinking water. There is need for water decontamination before using water drawn usage from the water sources.
References
[1] D. Schindler, “Tar sands need solid science,” Nature and Science, vol. 468, no. 23, pp. 499-501, 2010. View Article
[2] K.P. Timoney and P. Lee, “Polycyclic aromatic hydrocarbons increase in Athabasca river delta sediment temporal trend and environmental correlates,” Journal of Environmental Science & Technology, vol. 45, no. 10, pp. 4278-4284, 2011. View Article
[3] K. P. Timoney and R.A. Ronconi, “Annual bird mortality in the bitumen tailings in ponds in northeastern Alberta, Canada,” Wilson Journal of Ornithology, vol. 122, no. 3, pp. 569 – 576, 2010. View Article
[4] The Globe and Mail. (2017, July 25). Bird deaths reported on Alberta oil sands tailing pond [Online]. Available: https://www.theglobeandmail.com/news/national/bird-deaths-reported-on-alberta-oil-sands-tailing-ponds/article21473806/ View Article
[5] National Population Commission (NPC). Population and Housing Census, Federal republic of Nigeria, 2006.
[6] R. Balance and J. Bartram, “Water quality monitoring – a practical guide to the design and implementation of fresh water quality and monitoring study,” UNEP/WHO, London: Chapman and Hall, pp. 30-100, 2000.
[7] American Public Health Association (APHA), Standard Method for the Examination of Water and Waste water. 21st Ed., Washington D.C., USA, 2005.
[8] Map of parts of Ondo State, Nigeria. (2018, March). [Online]. Available: http://www.nigerianmuse.com View Article
[9] Federal Environmental Protection Agency (FEPA), now National Environmental Standards Regulatory and Enforcement Agency (NESREA), “Guideline for drinking water quality.” Federal Ministry of Environment, Nigeria, 1988//2007.
[10] WHO. (2018, May). Guideline for drinking water quality 2017.
[11] O. P. Sobukola, O. M. Adeniran, A. A. Odedairo, and O. E. Kajihausa, “Heavy metal level of some Fruits and leaf vegetables from selected markets in Lagos, Nigeria,” African J. of Food Sc., vol. 4, no. 2, pp. 389-393, 2010.
[12] LMédecins Sans Frontières. (2017). Environmental disaster[Online].Available:http://www.msf.org/en/taxonomy/term/1636 View Article
[13] J. O. Nriagu, M. I. Blackson, and K. Ocram, “Childhood Lead Poisoning in Africa, a Growing Public Health Problem,” Science Total Environ., vol. 181, no. 2, pp. 93-101, 1996.View Article
[14] K. O. Olayinka, “Pollutants in the environment: peregrination of an analytical chemist,” Inaugural Lecture Series, University of Lagos, Nigeria: Press and Bookshop, pp.1-50, 2016.
[15] E. O. Fagbote and E. O. Olanipekun, “Level of PAHs and PCBs in sediment of bitumen deposit impacted area,” Int. Jour. of Env. Sci. Techn., vol. 7, no. 3, pp/ 561–570, 2013.
[16] S. P. Howard, D. R. Rowe, and G. Tchobanoglous, Environmental Engineering. New York: McGraw-Hill, vol. 7, no. 8, pp. 69-70. 1985.
[17] F. M. Adebiyi and I. O. Asubiojo, “Assessment of element accumulation from bitumen deposits by vegetation using Energy Dispersive X-ray Fluorescence (EDXRF) Spectroscopy Technique,” Chem. Ecol., vol. 24, pp. 423-435, 2007. View Article
[18] P. B. Tchounwou, C. G. Yedjou, A. K. Patlolla, “Sutton DJ. Heavy Metals Toxicity and the Environment,” EXS, vol. 101, pp. 133-164, 2012. View Article
[19] O. T. Akoto, N. Bruce, and G. Darko, “Heavy metals pollution profiles in streams serving the Owabi Reservoir,” African Journal of Environmental Science and Technology, vol. 2, no. 11, pp. 354-359, 2008.
[20] O. S. Fatoki and R. Awofol. “Levels of Cd, Hg and Zn in some surface waters from the Eastern Cape Province, South Africa.” Water S.A., vol. 29, no. 4, pp. 375-379, 2003.
[21] E. O. Fagbote, and E. O. Olanipekun, “Level of PAHs and PCBs in sediment of bitumen deposit impacted area.” Int. Journal of Environmental Sciences and Technology, vol. 7, no. 3, pp. 561–570, 2013.View Article
[22] M. G. Adewole. “Environmental implication of bitumen seep induced-pollution in Parts of Ogun State Nigeria,” Env. Earth Sci. vol. 59, no. 7, pp. 1057-1060, 2010.
[23] T.M. Abatyough, I. O. Aderemi, O. Christian, A. Adedayo, J. Yusuf, and A. Salamatu, “Multivariate analysis of groundwater pollution sources in Agbabu Bitumen Belt,” American Chem. Science Journal, vol. 12, no. 4, pp. 1-11, 2016. View Article
[24] E. E. Atojunere, K. Ogedengbe, and S.O Afolayan, “Effects of Bitumen Deposits and Seepage on Soil Physico-chemical and Hydrological Properties in Agbabu, South West Nigeria,” Global Journal of Engineering & Technology, vol. 3, no. 2, pp. 257-261, 2010.
[25] E. E. Atojunere, K. Ogedengbe, and E. B. Lucas, “Development of Filtration and Bioremediation Technique for Decontaminating Bitumen-Polluted Water,” in Proceedings of the 2nd International Conference of Recent Trends in Environmental Science and Engineering (RTESE'18), Niagara, Canada, 2018, no. 111, pp. 1-9. View Article