International Journal of Environmental Pollution and Remediation (IJEPR)
ISSN: 1929-2732

Volume 7 - Year 2019 - Pages 1-8
DOI: 10.11159/ijepr.2019.001
Uncertainty Analysis on Global Greenhouse Gas Inventories from Anthropogenic Sources
Richao Cong1, Makoto Saito1, Ruichi Hirata1, Akihiko Ito1, Shamil Maksyutov1
1National Institute for Environmental Studies
16-2 Onogawa, Tsukuba, Ibaraki, Japan 3058506
richao.cong@nies.go.jp; saito.makoto@nies.go.jp; hirata.ryuichi@nies.go.jp; itoh@nies.go.jp; shamil@nies.go.jp
Abstract - As the concerns on climate change increased, accurately quantifying the greenhouse gas (GHG) emissions from anthropogenic sources has been emphasized more and more. In this paper, uncertainty analysis is conducted for multiple global GHG inventories from anthropogenic sources to explore the sources and the magnitude of them. We first summarize the principal characteristic for 17 global GHG inventories by four indexes. And then to assess the sources and magnitude of uncertainty for these inventories, the discrepancies are quantified on energy statistics data and estimation results of carbon dioxide (CO2) emission on anthropogenic sources at the global total and national scale. Finally, we determine the nations with larger magnitude (extent and proportion) of uncertainty by two indicators which will be helpful for the policy-making on GHG emissions mitigation. As the analysis result, we find that uncertainty of oil consumption data is the largest among major fuels in 2013 as much as 44.6 exajoules (EJ) and the magnitude of uncertainty in CO2 emissions data is significant at global perspective as much as 4.0 petagrams (Pg) CO2 yr-1. At national perspective, as the largest emitter nation in 2013 China, uncertainty from the coal consumption data of which is the largest in major fuels as much as 15.5 EJ and the magnitude of uncertainty for CO2 emissions of China in 2013 is as much as 1.5 Pg CO2 yr-1.
Keywords: GHG, CO2 emissions, Uncertainty analysis, Anthropogenic source, Inventory database.
© Copyright 2018 Authors This is an Open Access article published under the Creative Commons Attribution License terms. Unrestricted use, distribution, and reproduction in any medium are permitted, provided the original work is properly cited.
Date Received: 2018-06-26
Date Accepted: 2018-11-14
Date Published: 2019-02-01
1. Introduction
The current rise in atmospheric carbon dioxide (CO2) concentration is mainly caused by anthropogenic emissions and it is the largest contributor to modern climate change as proposed by global carbon budget (GCB) [1]. Reducing anthropogenic emissions is therefore crucial for controlling the climate change. National Greenhouse gases (GHG) emission inventory documents a country’s GHG sources and sinks over the course of a year so that it could track the change of anthropogenic emissions. To that end, national inventory reports are useful for evaluating agreed commitments to reduce emissions, estimating emissions for the past years, e.g. GCB, developing and carrying out new agreements on GHG mitigation, and making predictions for future under different scenarios [2]. Under the UN Framework Convention on Climate Change (UNFCCC), Annex I parties (developed countries) have agreed to submit annual inventories of anthropogenic GHG emissions from sources and their removal by sinks [3]. As an internationally agreed framework for estimating GHG inventories, the Intergovernmental Panel on Climate Change (IPCC) Guidelines for National Greenhouse Gas Inventories were issued in 1995 [4] with three subsequent versions for 1996 [5], 2000 [6] and 2006 [7].
Up to now numerous nations have made efforts to contribute for this global issue. However, as the absences of some nations, other global GHG inventories have to be relied on when the policy-making and scientific use are conducted at global scale. Consequently, numerous global GHG inventories have been developed, e.g., datasets from the Carbon Dioxide Information Analysis Center (CDIAC) [8], Emissions Database for Global Atmospheric Research (EDGAR) [9], and International Energy Agency (IEA) [10], each based on a different methodology or compilation procedure. Thus, how about the discrepancies between them?
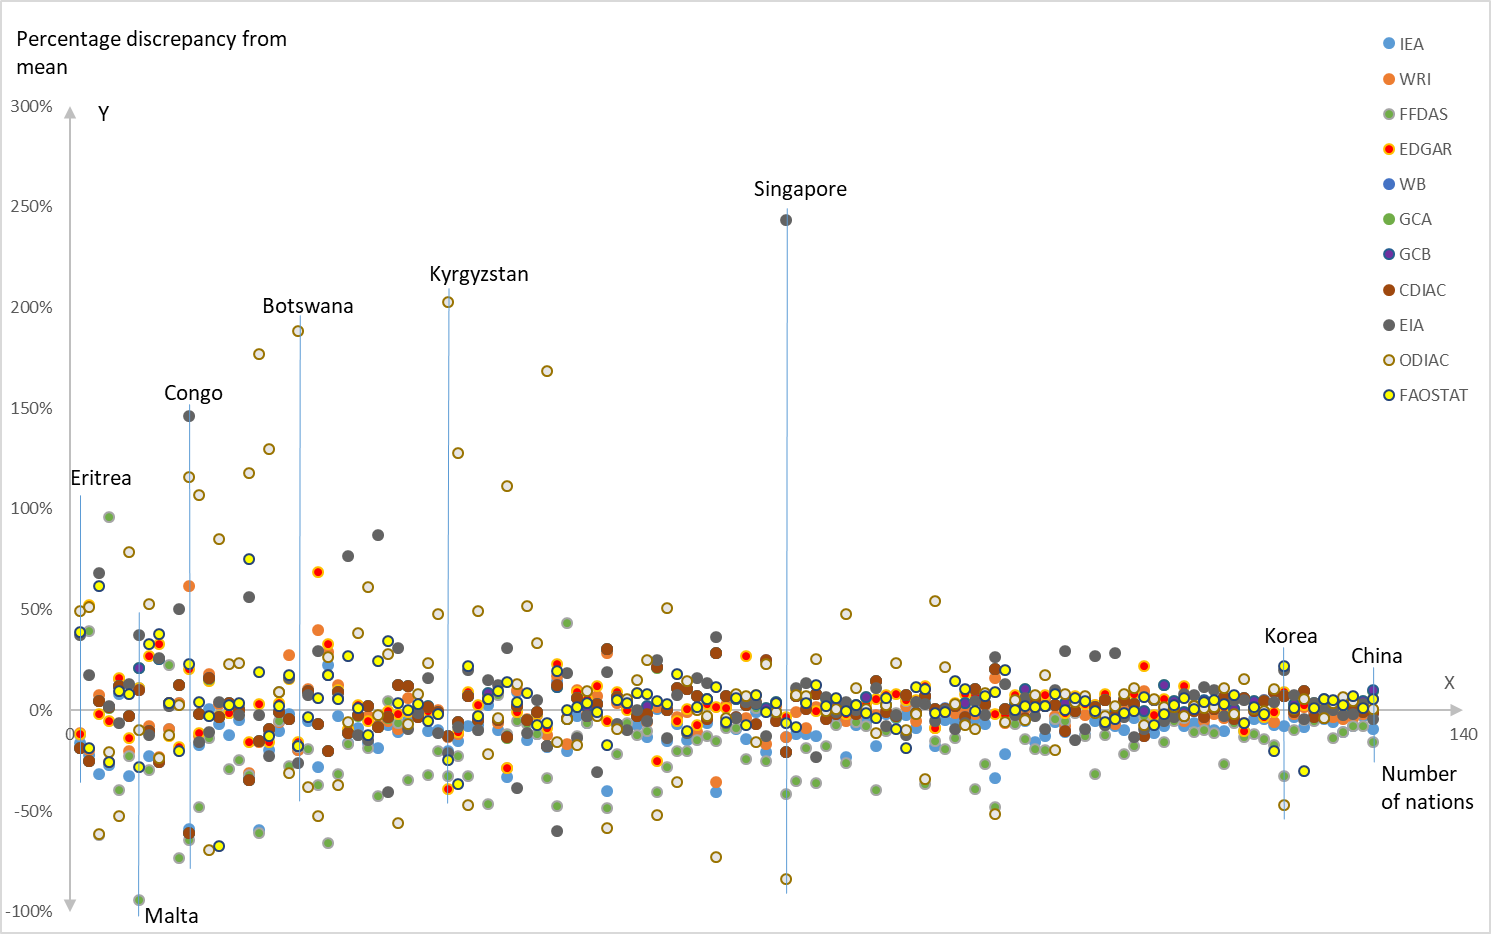
In Figure 1, we show the example of discrepancies on national CO2 emissions reported by 11 global GHG inventories for 131 nations in 2008. From this Figure, we could see much more outliers from e.g. Eritrea, Congo, Botswana, and Kyrgyzstan (less emissions nations) than that from the high emitter nations e.g. China, Korea, and the largest outlier could be as high as about 250% for Singapore. Estimated global GHG inventories include a degree of uncertainty, and in his analysis of four independent datasets, Macknick documented significant discrepancies on energy-use statistics and accounting methods. For instance, the international energy content reported by British Petroleum (BP) in 2005 differs from that provided by the US Energy Information Administration (EIA) by 11%, or 18 exajoules (EJ). Similarly, CO2 emissions estimates by the EIA and CDIAC for the United States in 2005 differ by >0.22 petagrams (Pg) CO2[11].
Under the Kyoto Protocol, the emissions reduction target set by EU15 members for the period 2008–2012 is ~8% below 1990 levels [12]. This target is made after referring to national inventory reports. To monitor the mitigation efforts correctly, accurately counting emissions is a key challenge. Uncertainty in the quantification result will disturb the evaluation on the reduction effect for climate mitigation actions. Thus, clarifying the sources of uncertainty and evaluating the magnitude of uncertainty in GHG emission inventories are urgently needed.
With above background, the objectives of this paper are made to clarify the sources and magnitude of uncertainty in multiple global GHG inventories. To do this, we first characterize the methodology and data sources for 17 GHG emission inventories. Then, the discrepancies on data source used for estimation (energy statistics data) and datasets (annual estimation result) are explored. Furthermore, we also made efforts on determining the nations with larger uncertainty and discuss the result. Finally, the conclusions are described.
Table 1. Characteristics of 17 GHG emission inventories by 4 indexes.
| Dataset | Time series | Scope* | Data source | Data description |
| BP | 1965-2017 | 73 | BP energy statistics | CO2 emission from fossil fuels combustion |
| CDIAC | 1751-2014 | 219 | UN statistics and publications | Global, regional total, and national CO2 emissions data by fuel type, cement production, and gas flaring with yearly grid map (0.1°resolution) |
| EDGAR | 1970-2012 | 214 | IEA and other statistics | Global total, national GHG emissions from all sectors, and other polluting gases with yearly grid map (0.1°resolution) |
| EIA | 1980-2016 | 226 | EIA statistics and publications | Global emissions on CO2, CH4, N2O from energy combustion by 5 sectors and national CO2 emissions |
| FOASTAT | 1990-2010 | 233 | FOASTAT and EDGAR | CO2,
CH |
| FFDAS | 1997-2010 | 203 | IEA statistics and publications | Global and national CO2 emissions from fossil fuel combustion with hourly gird map (0.1°resolution) |
| GCA | 1960-2016 | 218 | CDIAC, UNFCCC data sets; IEA, BP | National CO2 emissions by fuel types, cement and gas flaring and CH4 |
| GCB | 1959-2017 | 219 | CDIAC and publications | Global carbon budget, fossil emissions, land-use change emissions, ocean and terrestrial sink, national territorial emissions |
| IEA | 1971-2016 | 148 | IEA statistics | CO2 emissions from fuel combustion by fuel types or by 5 sectors |
| REAS | 2000-2008 | 30 | EDGAR, FAOSTAT; UN, IEA and other statistics | National anthropogenic CO2 and other polluting gases emissions in Asia with monthly grid map (0.25°resolution) |
| ODIAC | 2000-2016 | 226 | BP and some statistisc | Global and national fossil fuel CO2 emissions from proxy sources with monthly grid map (1°resolution) |
| OECD | 1990-2016 | 34 | IEA dataset | National CO2 emissions from fossil fuel combustion by 5 sectors and other GHGs emissions |
| PBL | 1990-2016 | 214 | EDGAR; BP and IEA statistics | Global, regional CO2 emissions from fossil fuels and cement by fuel types |
| PKU | 1960-2014 | 223 | EDGAR, FAOSTAT; EIA, IEA, UN and statistics | Global and national CO2 emissions from fuel combustion by eight groups, with annual grid map (0.1°resolution) |
| UNFCCC | 1990-2016 | 44 | Governmental submissions | National CO2, CH4, N2O and F-gases emissions by 7 sectors |
| WB | 1960-2014 | 217 | CDIAC and statistics | National CO2 emissions by fuel types, cement and gas flaring |
| WRI | 1990-2014 | 186 | CDIAC, IEA, FAOSTAT datasets; EIA statistics | National CO2, CH4, N2O and F-gases emissions from fossil fuels and cement by fuel types and by sectors |
*Note: Several values included in the Table are derived from the accessible websites of the respective inventories, while others have been counted by the authors from the datasets. The abbreviations of datasets are explained as follows:
FAOSTAT: Food and Agriculture Organization Corporate Statistics Database [13]
FFDAS: Fossil Fuel Data Assimilation System [14]
GCA: Global Carbon Atlas [15]
GCB: Global Carbon Budget [1]
REAS: Regional Emission inventory in Asia [16]
ODIAC: Open-source Data Inventory of Anthropogenic CO2 emission [17]
OECD: Organisation for Economic Co-operation and Development [18]
PBL: Planbreau voor de Leefomgeving [19]
PKU: Peking University Fuel and CO2 inventories [20]
WB: World Bank [21]
WRI: World Resources Institute [22]
2. Methodology
In this study, 17 global GHG inventories are gathered and characterized by four indexes. To explore the uncertainty from them, differences are checked in details focusing on the energy statistics data and the estimation result. Differences on the apparent energy consumption by fuel type reported by 4 major energy statistics organizations are compared on global and national scale. And the discrepancies on CO2 emission estimate result from 10 global inventories are also evaluated for global and national scale in 2013. Furthermore, we also make efforts on determining the nations with larger uncertainty by 2 indicators.
2.1. Characteristics of the Principal Datasets in Global GHG Inventories
As shown in Table 1, these inventories were classified by the indexes of time series, scope, data source, and data description. For data source index, most of inventories rely on statistical data provided by the United Nations (UN), IEA, EIA, and BP. We note, however, that even when the same data are used, the total emissions of a given nation or sector can vary depending on the statistics rules used, e.g., report integrity, classification rules, and conversion factors for calorific content. Further uncertainty results from the incorporation of different emission factors and accounting methods, as well as the subjective classification of emission categories by reporting organizations. The quality of emission inventories is considered to rely on the integrity of the methodology used, completeness of reporting, and the procedures employed for data compilation.
2.2. Uncertainty from Energy Statistics Data
To access the discrepancies from the energy data sources, apparent energy consumption data of global total and the largest consumer nation of China in 2013 by fuel types are compared between 4 major energy statistics organizations. Apparent energy consumption includes the production, import, export, and stock change of energy. The data was extracted and summarized from the online statistics tool [23-24], energy statistics yearbook [25], and official annual report [26].
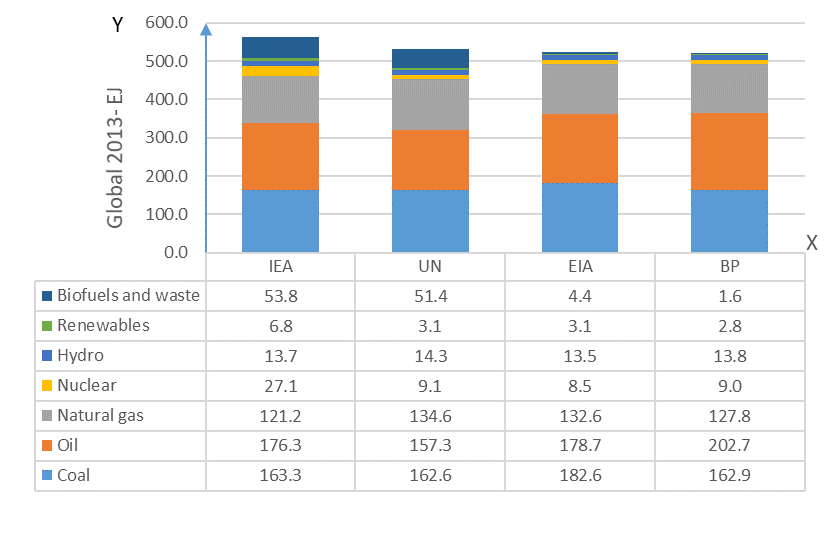
As shown in Figure 2, from the global perspective, the global total apparent energy consumption in 2013 from IEA statistics is the largest of all. In particularly, nuclear, renewables and biofuels & waste consumption from IEA are larger than that from others. Most of the values from UN statistics are close to IEA except nuclear and oil consumption. EIA statistics reports the largest coal consumption data among them. BP statistics just reports the commercial energy use therefore the total value of which is the smallest of all. However, the oil consumption from BP is the largest one. The gap between maximum (IEA) and minimum (BP) of global total energy consumption is about 24.3 EJ. The global total biofuels & waste consumption owned the largest uncertainty (52.2 EJ between IEA and BP statistics) of all fuels as only commercial fuels are reported by BP. Focusing on 3 kinds of major fuels e.g. coal, oil, and gas, oil consumption owns the largest uncertainty of all that is about 44.6 EJ between BP and UN statistics.
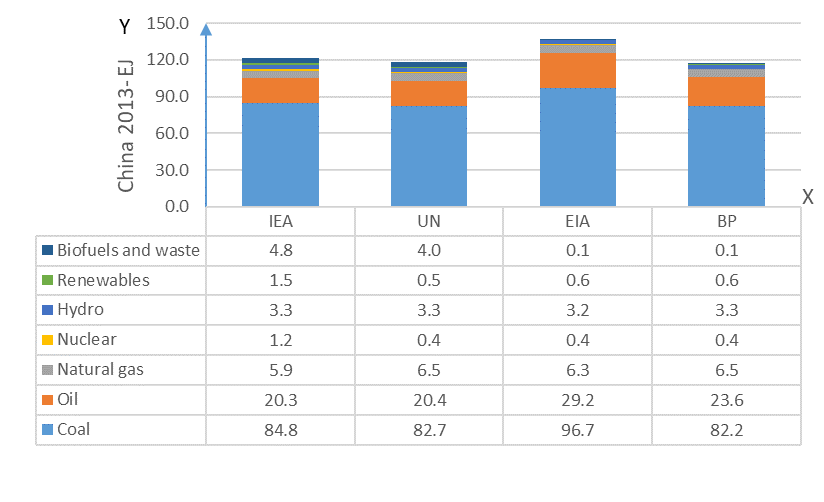
Familiar with global perspective, comparison result from national energy consumption aspect was shown in Figure 3. We could see that consumption data on nuclear, renewables, and biofuels & waste for China in 2013 reported by IEA statistics are larger than that by others. The oil, coal consumption, and the total consumption values from EIA statistics are the largest of all. The gap on total energy consumption of China in 2013 between maximum (EIA) and minimum (UN) is about 18.7 EJ. The uncertainty of coal consumption is the largest of all fuels (15.5 EJ).
2.3. Uncertainty from Inventory Datasets
To access the discrepancies between GHG emission Inventories, global total CO2 emissions in 2013 reported by 10 inventories are compared as the rest ones are lack of data for 2013. Comparison result from global perspective is shown in Figure 4, we could see significant discrepancies on global total CO2 emissions in 2013 between these inventories. The gap between the maximum (GCB) and minimum values (IEA) is about 4.0 Pg CO2 yr-1.
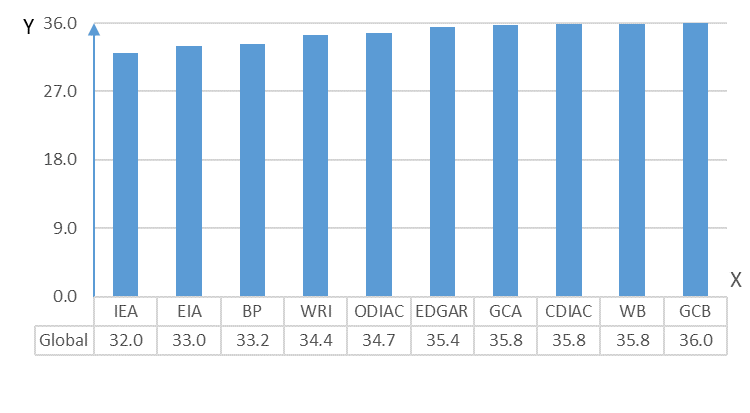
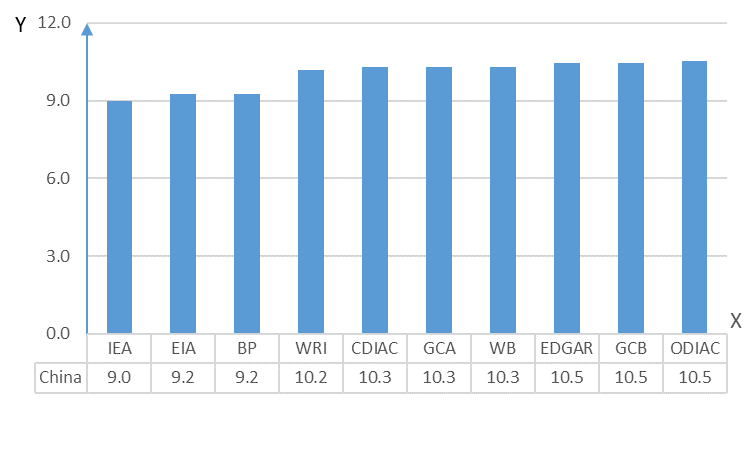
Moreover, GCA, CDIAC, and WB inventories report the global total emissions closely. From the national scale as the result shown in Figure 5, some organizations report the total CO2 emissions of China in 2013 closely such as EIA and BP; CDIAC, GCA, and WB; EDGAR, GCB, and ODIAC. The value of IEA is the smallest and that of ODIAC is the largest. And the gap between them is about 1.5 Pg CO2 yr-1.
2.4. Determination for the Nations with Larger Uncertainty in Inventories
The uncertainty from the datasets across 11 inventories were evaluated by using the reported CO2
emissions for 131 nations in 2008. Other datasets lacking detailed or full national emissions coverage were excluded from assessment. To show the extent and proportion of uncertainty, standard deviation (SD) and mean percentage of absolute discrepancy (MPAD) were made as indictors. Applying the equation of mean absolute percentage error [27], MPAD is defined as equation 1.

Where  is the name of one dataset,
  is the name of one nation,
  is the CO2 emissions in 2008 for nation in dataset (Pg CO2 yr-1), and
  is the mean emissions in 2008 for nation across
  datasets, here = 11.
3. Result and Discussion
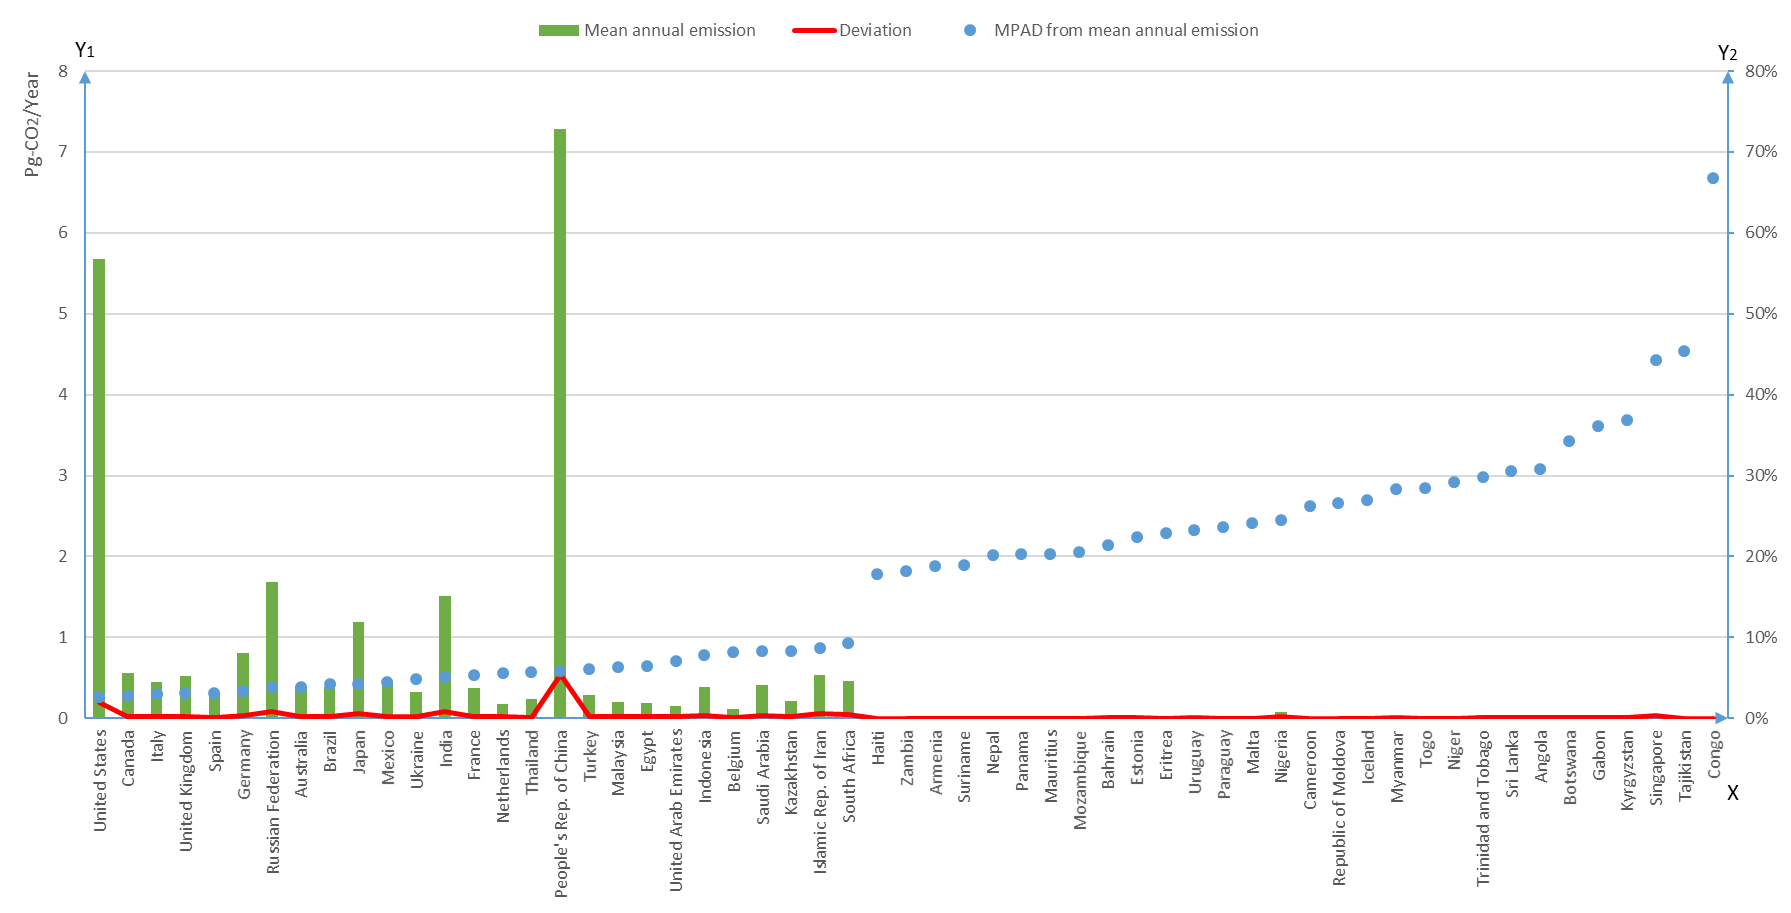
As shown in Figure 6, 57 nations with larger uncertainty (top 30 nations by MPAD values mixed with top 30 nations by SD values) were selected and ranked by MPAD values that were depicted by the dots. From this Figure, we could see that higher MPAD values typically occur in nations with less emissions and lower SD values, reflecting a tendency for the proportion of uncertainty among the datasets to increase as total emissions decrease. The three nations with the largest MPAD are Congo (66.7%; SD 2.5E-3 Pg CO2 yr-1; mean annual CO2 emissions 3.3E-3 Pg CO2 yr-1), Tajikistan (45.4%; SD 2.3E-3 Pg CO2 yr-1; mean annual CO2 emissions 4.4E-3 Pg CO2 yr-1), and Singapore (44.2%; SD 3.6E-2 Pg CO2 yr-1; mean annual CO2 emissions 4.5E-2 Pg CO2 yr-1).
For larger emission nations shown on the left half of this Figure, the proportion of uncertainty is smaller yet the SD and mean annual emissions of that remain significant. For instance, the three nations with the largest SD of annual emissions are China (MPAD 5.8%; SD 5.4 Pg CO2 yr-1; mean annual emissions 7.3 Pg CO2 yr-1), the United States (MPAD 2.6%; SD 1.9 Pg CO2 yr-1; mean annual emissions 5.7 Pg CO2 yr-1), and India (MPAD 5.1%; SD 0.9 Pg CO2 yr-1; mean annual emissions 1.5 Pg CO2 yr-1). Therefore, to facilitate climate change policy, the proportion and extent of uncertainty in GHG inventories need to be considered together, and particular attentions should be paid to the nations with higher SD and MPAD values.
4. Conclusion
In this paper, 17 datasets used in current global GHG inventories were characterized by four indexes and the uncertainty from that were quantified by two aspects, e.g. energy statistics data source and inventory estimation results in global and national scale.
From energy statistics aspect, we found that the global total apparent energy consumption in 2013 from 4 major energy statistics organizations contained significate uncertainty, e.g. biofuels & waste consumption with the largest uncertainty (52.2 EJ between IEA and BP statistics). Among three major fuels, the oil consumption owned the largest uncertainty (44.6 EJ between BP and UN statistics). The gap between maximum (IEA) and minimum (BP) of global total energy consumption was about 24.3 EJ. As the largest energy consumer in 2013, the coal consumption of China owned the largest uncertainty (15.5 EJ) of all fuels. The gap between maximum (EIA) and minimum (UN) of China total energy consumption was about 18.7 EJ.
From GHG emissions aspect, we found that the global total CO2 emissions in 2013 also owned considerable uncertainty among 10 inventories. And the gap between the maximum (GCB) and minimum (IEA) was about 4.0 Pg CO2 yr-1. Some inventories reported global total emissions closely, e.g. GCA, CDIAC, and WB. For the largest emitter nation in 2013, some organizations reported the total CO2 emissions of China in 2013 closely, e.g. EIA and BP; CDIAC, GCA, and WB; EDGAR, GCB, and ODIAC. And the maximum differences between ODIAC and IEA were about 1.5 Pg CO2 yr-1.
Moreover, 57 nations with larger uncertainty in GHG emissions inventories of 2008 were selected to support the policymakers when improving these GHG emission inventories. We suggested that more focuses needed to be placed on these nations exhibiting higher SD and MPAD values and proposed that the expertise for reducing uncertainty needed to be made more widely available. The uncertainty described above likely resulted from both the choice of data source and the methodology used to estimate emissions. For example, the use of variable statistical frameworks will increase the uncertainty associated with data sources. Similarly, the use of different emissions factors, accounting methods, and emissions classifications constitute the primary sources of uncertainty in the reporting of data. Therefore, to improve the quality of anthropogenic GHG inventories, investigators need to scrutinize the integrity of their methodology, the completeness of reporting, and procedures for data compilation.
References
[1] GCB. (2018, November 1). Global Carbon Budget [Online]. Available: http://www.globalcarbonproject.org/carbonbudget/
[2] T. Spencer, M. Colombier, X. Wang, O. Sartor, and H. Waisman. “Chinese emission peak: not when, but now.” IDDRI Working papers, no. 7, pp. 22, 2016.
[3] UNFCCC. United Nations Framework Convention on Climate Change. Article 4, Para 1(a), 1992.
[4] IPCC. IPCC Guidelines for National Greenhouse Gas Inventories. Bracknell, United Kingdom: Meteorological Office, 1995
[5] IPCC. Revised 1996 IPCC Guidelines for National Greenhouse Gas Inventories: Vol. 1, 2 and 3. Paris, France: IPCC/OECD/IEA, 1997.
[6] IPCC. Good Practice Guidance and Uncertainty Management in National Greenhouse Gas inventories. Hayama, Japan: IPCC/OECD/IEA/IGES, 2000
[7] IPCC. A primer, Prepared by the National Greenhouse Gas Inventories Programme, 2006 IPCC Guidelines for National Greenhouse Gas Inventories, Published: IGES, 2008.
[8] T. A. Boden, G. Marland, and R. J. Andres. (2018, November 1). Global, Regional, and National Fossil-Fuel CO2 Emissions [Online]. Available: http://dx.doi.org/10.3334/CDIAC/00001_V2017
[9] EDGAR. (2018, November 1). Global Emissions EDGAR v4.3.2 [Online]. Available: https://data.europa.eu/doi/10.2904/JRC_DATASE T_EDGAR
[10] IEA. (2018, November 1). CO2 Emissions from Fuel Combustion Highlights 2017 [Online]. Available: https://www.iea.org/publications/freepublications/publication/CO2-emissions-from-fuel-combustion-highlights-2017.html
[11] J. Macknick. Energy and carbon dioxide emission data uncertainty [Online]. Available: http://pure.iiasa.ac.at/9119, 2009.
[12] EEA. (2017, May 1). Greenhouse gas emission trends and projections in Europe 2009: Tracking progress towards Kyoto targets [Online]. Available: http://dx.doi.org/10.2800/23935
[13] FAO. (2018, November 1). FAOSTAT Agri-Environmental Indicators, Emissions by Sector [Online]. Available: http://www.fao.org/faostat/en/#data/EM
[14] FFDAS. (2018, November 1). FFDAS data retrieval [Online]. Available: http://hpcg.purdue.edu/FFDAS/map.php
[15] GCA. (2018, November 1). Global Carbon Atlas. CO2 EMISSIONS [Online]. Available: http://www.globalcarbonatlas.org/en/content/welcome-carbon-atlas
[16] REAS. (2018, April 1). Data Download Site [Online]. Available: https://www.nies.go.jp/REAS/
[17] T. Oda, S. Maksyutov, and R. J. Andres. The Open-source Data Inventory for Anthropogenic CO2, version 2016 (ODIAC2016): a global monthly fossil fuel CO2 gridded emissions data product for tracer transport simulations and surface flux inversions. Earth System Science Data, Vol. 10, No. 1, pp. 87-107, 2018. View Article
[18] OECD. (2018, November 1). GHG emissions [Online]. Available: http://www.compareyourcountry.org/climate-policies?cr=oecd&lg=en&page=1&visited=1#
[19] PBL Netherlands Environmental Assessment Agency. (2018, November 1). Trend in global CO2 emissions [Online]. Available: http://www.pbl.nl/en/trends-in-global- CO2-emissions
[20] PKU. (2018, November 1). PKU-Inventory [Online]. Available: http://inventory.pku.edu.cn/home.html
[21] WB. (2018, November 1). CO2 emissions [Online]. Available: https://data.worldbank.org/indicator/EN.ATM.CO2E.KT
[22] CAIT. (2018, November 1). CAIT Climate Data Explorer: Historical Emissions [online]. Available: http://cait.wri.org
[23] IEA. (2018, November 1). Statistics Search [Online]. Available: http://www.iea.org/statistics/statisticssearch/
[24] EIA. (2018, November 1). International Energy Statistics [Online]. Available: https://www.eia.gov/beta/international/
[25] UN. (2018, November 1). 2015 Energy Statistics Yearbook [Online]. Available: https://unstats.un.org/unsd/energy/
[26] BP. (2018, November 1). BP Statistics Review of World Energy June 2017 (66th ed.) [Online]. Available: https://www.bp.com/
[27] S. Kim and H. Kim, “A new metric of absolute percentage error for intermittent demand forecasts,” International Journal of Forecasting, vol. 32, no. 3, pp. 669-679, 2016.View Article