International Journal of Environmental Pollution and Remediation (IJEPR)
ISSN: 1929-2732

Volume 6 - Year 2018 - Pages 32-40
DOI: 10.11159/ijepr.2018.004
Atmospheric Pollutants and the Occurrence of Bromeliads in Electric Power Distribution Network
Gleiciane Fernanda de Carvalho Blanc1, Bernardo Lipski1, Juliano José da Silva Santos1,
Karime Dawidziak Piazzetta1, Juliane de Melo Rodrigues1, Luciana Leal2
1Institutos Lactec, Department of Environmental Resources
Centro Politécnico da UFPR. Rodovia BR-116, km 98, n° 8813, Curitiba, Paraná, Brasil, 81531-980
gleiciane.carvalho@lactec.org.br; bernardo.lipski@lactec.org.br; juliano.santos@lactec.org.br;
karime.piazzetta@lactec.org.br; juliane@lactec.org.br
2Copel Distribuição S.A.
Rua José Izidoro Biazetto, n° 158, Curitiba, Paraná, Brasil, 81200-240
luciana.leal@copel.com
Abstract - The occurrence of atmospheric bromeliads (Tillandsia spp. – Bromeliaceae) in the structures of electric power distribution networks is a problem for energy concessionaires. It causes the impression of abandonment and energy distributors do not have enough information to understand the impacts caused by this infestation. A research project is underway to investigate possible factors contributing to bromeliad occurrence in these structures. One stage of the project is to evaluate the correlation between atmospheric pollutants and the occurrence of bromeliads in urban electric network cables. This was made by using principal component analysis to evaluate the correlation between atmospheric pollutants concentration obtained by dispersion modelling and field data of bromeliad abundance. The results indicate a correlation between pollutants and infestation of bromeliads in regions with higher vehicular than industrial emissions in the study area (Ponta Grossa city, Paraná State, Brazil).
Keywords: Air quality, vehicular emissions, Tillandsia spp., principal component analysis.
© Copyright 2018 Authors - This is an Open Access article published under the Creative Commons Attribution License terms Creative Commons Attribution License terms. Unrestricted use, distribution, and reproduction in any medium are permitted, provided the original work is properly cited.
Date Received: 2017-06-23
Date Accepted: 2017-11-22
Date Published: 2018-05-07
1. Introduction
The study of atmospheric pollution became important for researchers and society with the development of large urban centres and the industrial revolution. Since then, air quality has been changing and impacting population health and the environment. One tool used to investigate pollutant behaviour and control and manage air quality is mathematical modelling of atmospheric pollutant dispersion. Models have been widely used in scientific and engineering projects and are often applied to find solutions to environmental problems [1].
The occurrence of atmospheric bromeliads (Tillandsia spp. – Bromeliaceae) in electric power distribution network structures is a problem for energy concessionaires. The presence of bromeliads provides a negative visual effect and causes the impression of abandonment and lack of asset maintenance. In addition, energy distributors carry the costs for cleaning infested cables and do not have the information to define best maintenance practices nor to understand the impacts caused by this infestation. Situations such as this have already been reported in Brazil – [2] and [3] – and in other countries – [4] and [5]. However, there still has been no in-depth research on the subject.
Studies developed in the city of Curitiba, State of Paraná, Brazil, related the bromeliad occurrence to pollution from vehicular sources – [3] and [6]. The first study [3] used the atmospheric pollutants concentration obtained by dispersion modelling as basis to comparison with data obtained in 26 points identified in the city with bromeliads presence in electric power distribution cables. The results showed that the most part of the selected points were close to locals with high vehicle traffic and the dispersion modelling presented high pollutants concentration by mobile sources in those points. The study concludes that might have a relationship between vehicle emissions and the occurrence of bromeliads in the energy cables.
The second study [6] focus on the assessment of bromeliad Tillandsia recurvata as potencial bioindicator of urban atmospheric pollution. Five sampling point were selected and classified according vehicle traffic. In those points, bromeliads were collected and analysed its abundance and metals accumulation (Fe, Cd, Cr, Cu, Pb and Zn). The results showed that the bromeliad abundance and the metals accumulation is bigger in areas with higher vehicle traffic. The study’s conclusion is that the bromeliad has potencial as bioindicator in urban areas, especially related with metals accumulation.
A research project in partnership with the local energy concessionaire has been developed with the objective of investigating possible factors that contribute to bromeliad fixation in energy distribution network structures. One stage of this project, presented here, was to evaluate the correlation between atmospheric pollutants and bromeliad occurrence in electric network structures. Using the same approach as study [3], with atmospheric pollutant dispersion modelling, this study aims to evaluate the correlation with bromeliad occurrence in a different area and with more field data.
2. Theoretical Framework
The presence of atmospheric bromeliads (Tillandsia spp. - Bromeliaceae) in aerial electric power distribution networks has been reported in urban areas of several Brazilian cities and in other countries in the South American continent. Although bromeliads appear to exist harmoniously with energy networks, it is assumed that in addition to visual aspects, bromeliads can cause problems related to safety and energy supply quality, as well as hamper the visual inspection of networks, precluding preventive defect verification by maintenance teams [3].
The relationship between species of the genus Tillandsia and energy distribution networks is long known and of wide geographic occurrence, although little studied. Infestations dating back to 1951 in the state of Santa Catarina, Brazil, have been reported [2]. In addition, the establishment and growth of Tillandsia spp. have been studied in Argentina [4], Panama [5], Mexico [7] and Costa Rica [8].
The genus Tillandsia consists of aerial species capable of inhabiting naked rocks, exposed branches or even dead trees and wooden poles. Tillandsia species are usually called weeds and can reach significant degrees of infestation on trees and shrubs in altered environments [9] [10].
Several bromeliad species have been studied as bioindicators of atmospheric pollution, mainly by heavy metals. Some of the studies reported in the literature – [11]-[21] – evaluated Tillandsia species as potential bioindicators of air pollution in several countries, such as Colombia, Argentina, Mexico and Bolivia. In Brazil, there are only a few studies that have reported the use of Tillandsia species as air pollution bioindicators in urban areas – [22]-[25] and [6].
Tillandsia recurvata is the most common species present in electric power distribution networks and can be found from Chile to Argentina in South America, to the Caribbean and Central America, reaching Mexico and Southeast North American [6]. In North America and Europe, Tillandsia recurvata is commonly known as “ball moss” although it does not belong to the group of mosses, or bryophytes [3].
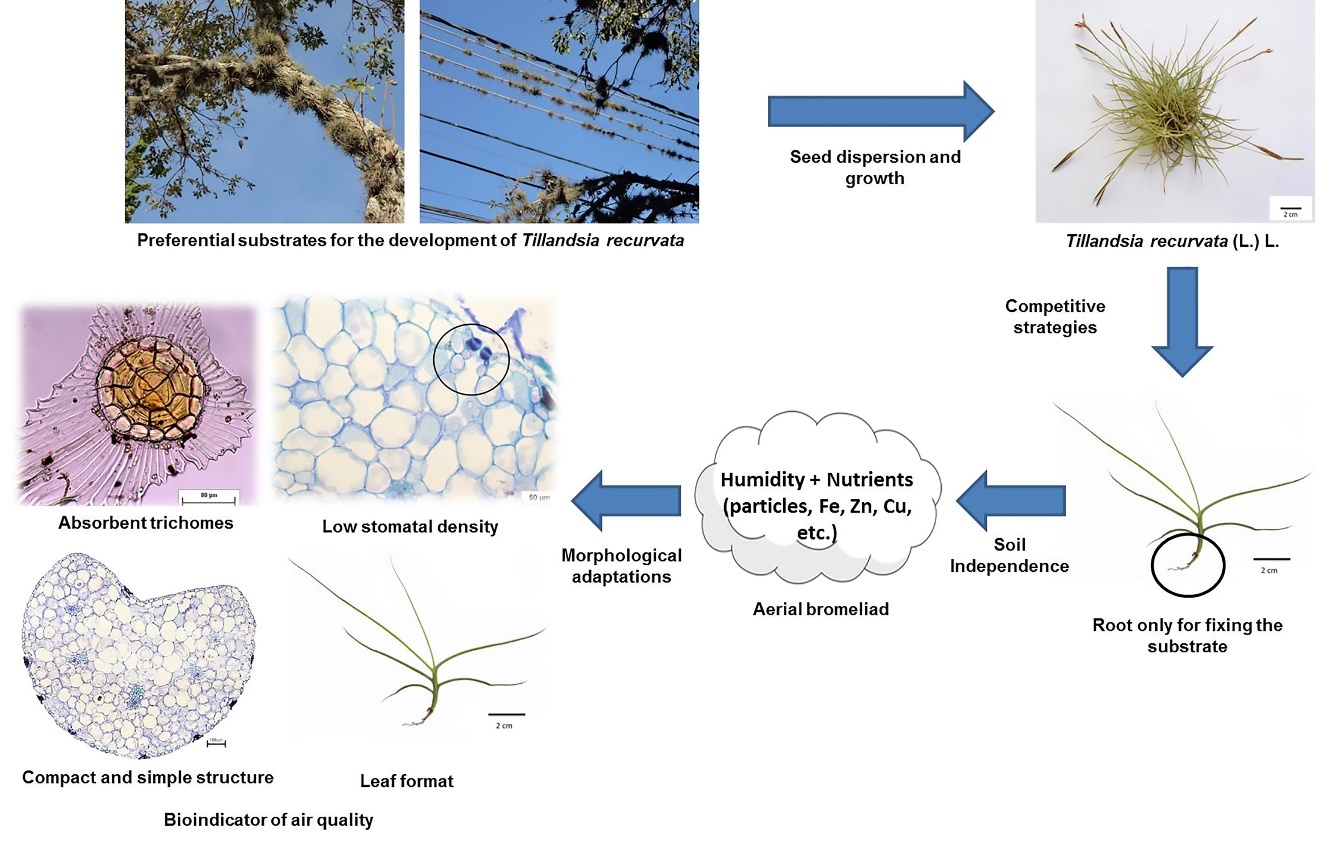
Piazzetta [6] presented and summarized the Tillandsia recurvata characteristics that show its potential as an atmospheric pollution bioindicator in urban environments with some degree of air quality alteration (Figure 1); once the species colonizes several substrates, it obtains water and nutrients directly from the atmosphere. Tillandsia recurvata roots function only for fixation, guaranteeing their independence from soil.
3. Methodology
The AERMOD View 9.1 model was used to simulate the atmospheric pollutant dispersion in the study area. AERMOD is a steady-state Gaussian plume model, developed by the American Meteorological Society (AMS) and the U.S. Environmental Protection Agency (EPA) as a formal collaboration group called AMS/EPA Regulatory Model Improvement Committee. The EPA adopted the AERMOD as the preferred regulatory model.
The model is applicable to rural and urban areas, flat and complex terrain, surface and elevated releases, and multiple sources (including, point, area and volume sources). The modelling system consists of one main program (AERMOD) and two pre-processors (AERMET and AERMAP). AERMET uses meteorological measurements, representative of the modelling domain, to compute certain boundary layer parameters used to estimate profiles of wind, turbulence and temperature in the AERMOD. AERMAP is used to create receptor grids and it uses gridded terrain data to calculate a representative terrain-influence height. The AERMOD provides the pollutants’ concentration at ground level on each receptor in averaging time and the maximum concentration for the period [26].
3.1. Study Area and Model Data Inputs
The area defined for the study was the urban area of the city of Ponta Grossa (S25°05’42”, W50°09’43”), State of Paraná, Brazil, which presents the highest bromeliad infestation in the state’s electric power distribution network.
The AERMOD model requires meteorological, topographic, emission source and receptor data. For meteorological data, five years of hourly data were considered, from January 1, 2010 to December 31, 2014, obtained from an existing automatic meteorological station in the city. The following variables were used: temperature (°C), relative humidity (%), atmospheric pressure (hPa), radiation (W/m²), precipitation (mm), speed (m/s) and wind direction. Cloud cover data (in tenths) were obtained from the nearest conventional meteorological station with daily data. It was used the daily cloud clover data for all hours of the day.
Topographic data were obtained from contour curves of the Hydrographic Base of the State of Paraná. Contour curves are at 1:50,000 scale with a resolution of 20 metres. In the modelled area, altitude varies from approximately 770 to 1090 metres.
Eighteen industries were considered as fixed sources of pollutant emissions and twenty-one streets with high vehicle circulation as mobile sources. For each source, emission rates were considered for the following pollutants: nitrogen oxides (NOx), carbon monoxide (CO), sulphur dioxide (SO2), total particulate matter (PM) and total hydrocarbons (HCT).
Simulation of atmospheric dispersion in Ponta Grossa was based on a uniform grid of receptors defined by an area of 430 km², 20.0 km long and 21.5 km wide, totalling 1804 receptors spaced every 500 metres horizontally and vertically. Sites with bromeliad infestation in the electric network were identified in the field and were used as discrete receptors for pollutant concentration calculations.
3.2. Field Data
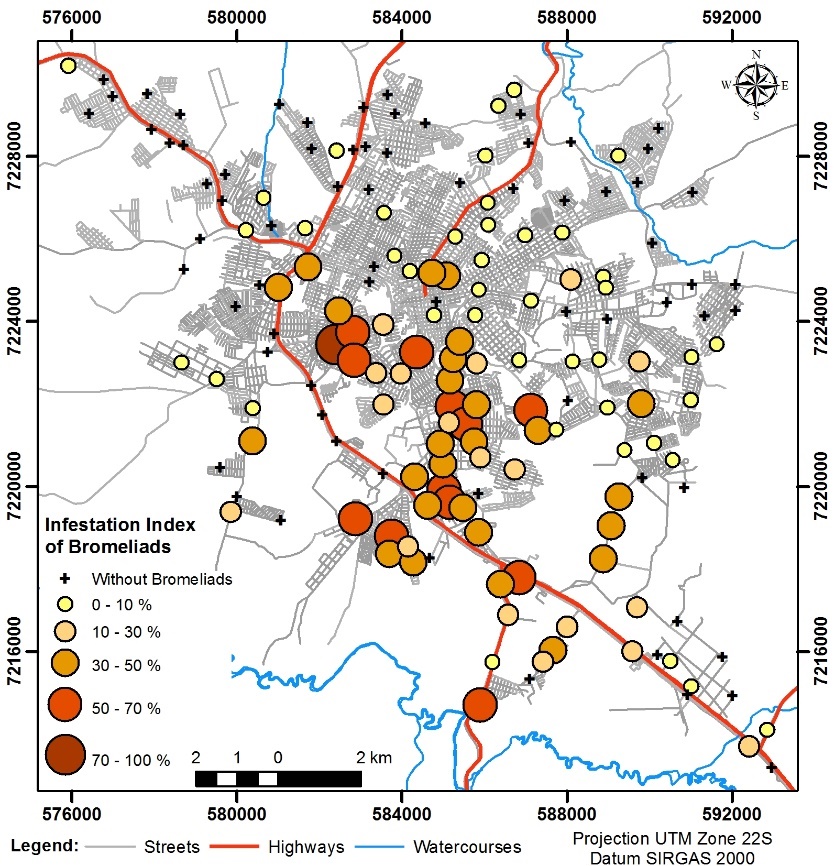
Between May and June 2016, bromeliad infestation sites were identified in the study area by dividing the city into squares. These sites were georeferenced and bromeliad abundance was evaluated; occupation percentages were determined according to biomass. The higher the biomass, the greater the percentage. The classes considered were: 0 to 10, 10 to 30, 30 to 50, 50 to 70 and 70 to 100%.
3.3. Statistical Analysis
Principal component analysis was used to evaluate the correlation between field and model results. The data matrix was constructed so that rows represented sites with bromeliad infestation and columns represented the five concentration classes of each pollutant and the classes of bromeliad biomass.
4. Results and Discussion
In the study area, 171 sites were visited and in 99 bromeliads were identified as adhering to electric power distribution network structures. A map with a site infestation index characterizes the percentage of bromeliad biomass occupations (Figure 2).
Pollutant maximum hourly concentrations and average concentrations for the five-year period obtained from modelling the 171 sites are presented in Figure 3, and the stationary and mobile sources are considered separately.
The highest carbon monoxide concentrations are obtained in the city centre and along the highways and avenues of greater flow, the regions strongly influenced by vehicular emissions. For stationary sources, despite modelling considerations including industries with CO emissions, their contribution is significantly lower (approximately 10%) than emission contributions from vehicular traffic (approximately 90%).
For total hydrocarbons, both stationary and mobile emission sources contribute to the simulated concentrations. As shown in Figure 3, concentrations from fixed sources, mainly metallurgical industries, are concentrated in the area close to their point of emission, while original vehicular emission contributions are evident in central Ponta Grossa where there is a greater flow of vehicles as well as in the areas along highways and avenues with greater flow.
The contribution of stationary sources is also verified in the regions around emission points for the particulate material. Vehicular emissions make no significant contribution to PM concentrations. The concentrations obtained are distributed equally in the central area of the city as well as in the most remote areas and in the regions near the highways. It should be noted that in addition to stationary and mobile sources considered in the modelling, there are diffuse sources, such as resuspension and secondary formation, not addressed in this study, which may explain the low concentrations of this pollutant obtained in the simulations.
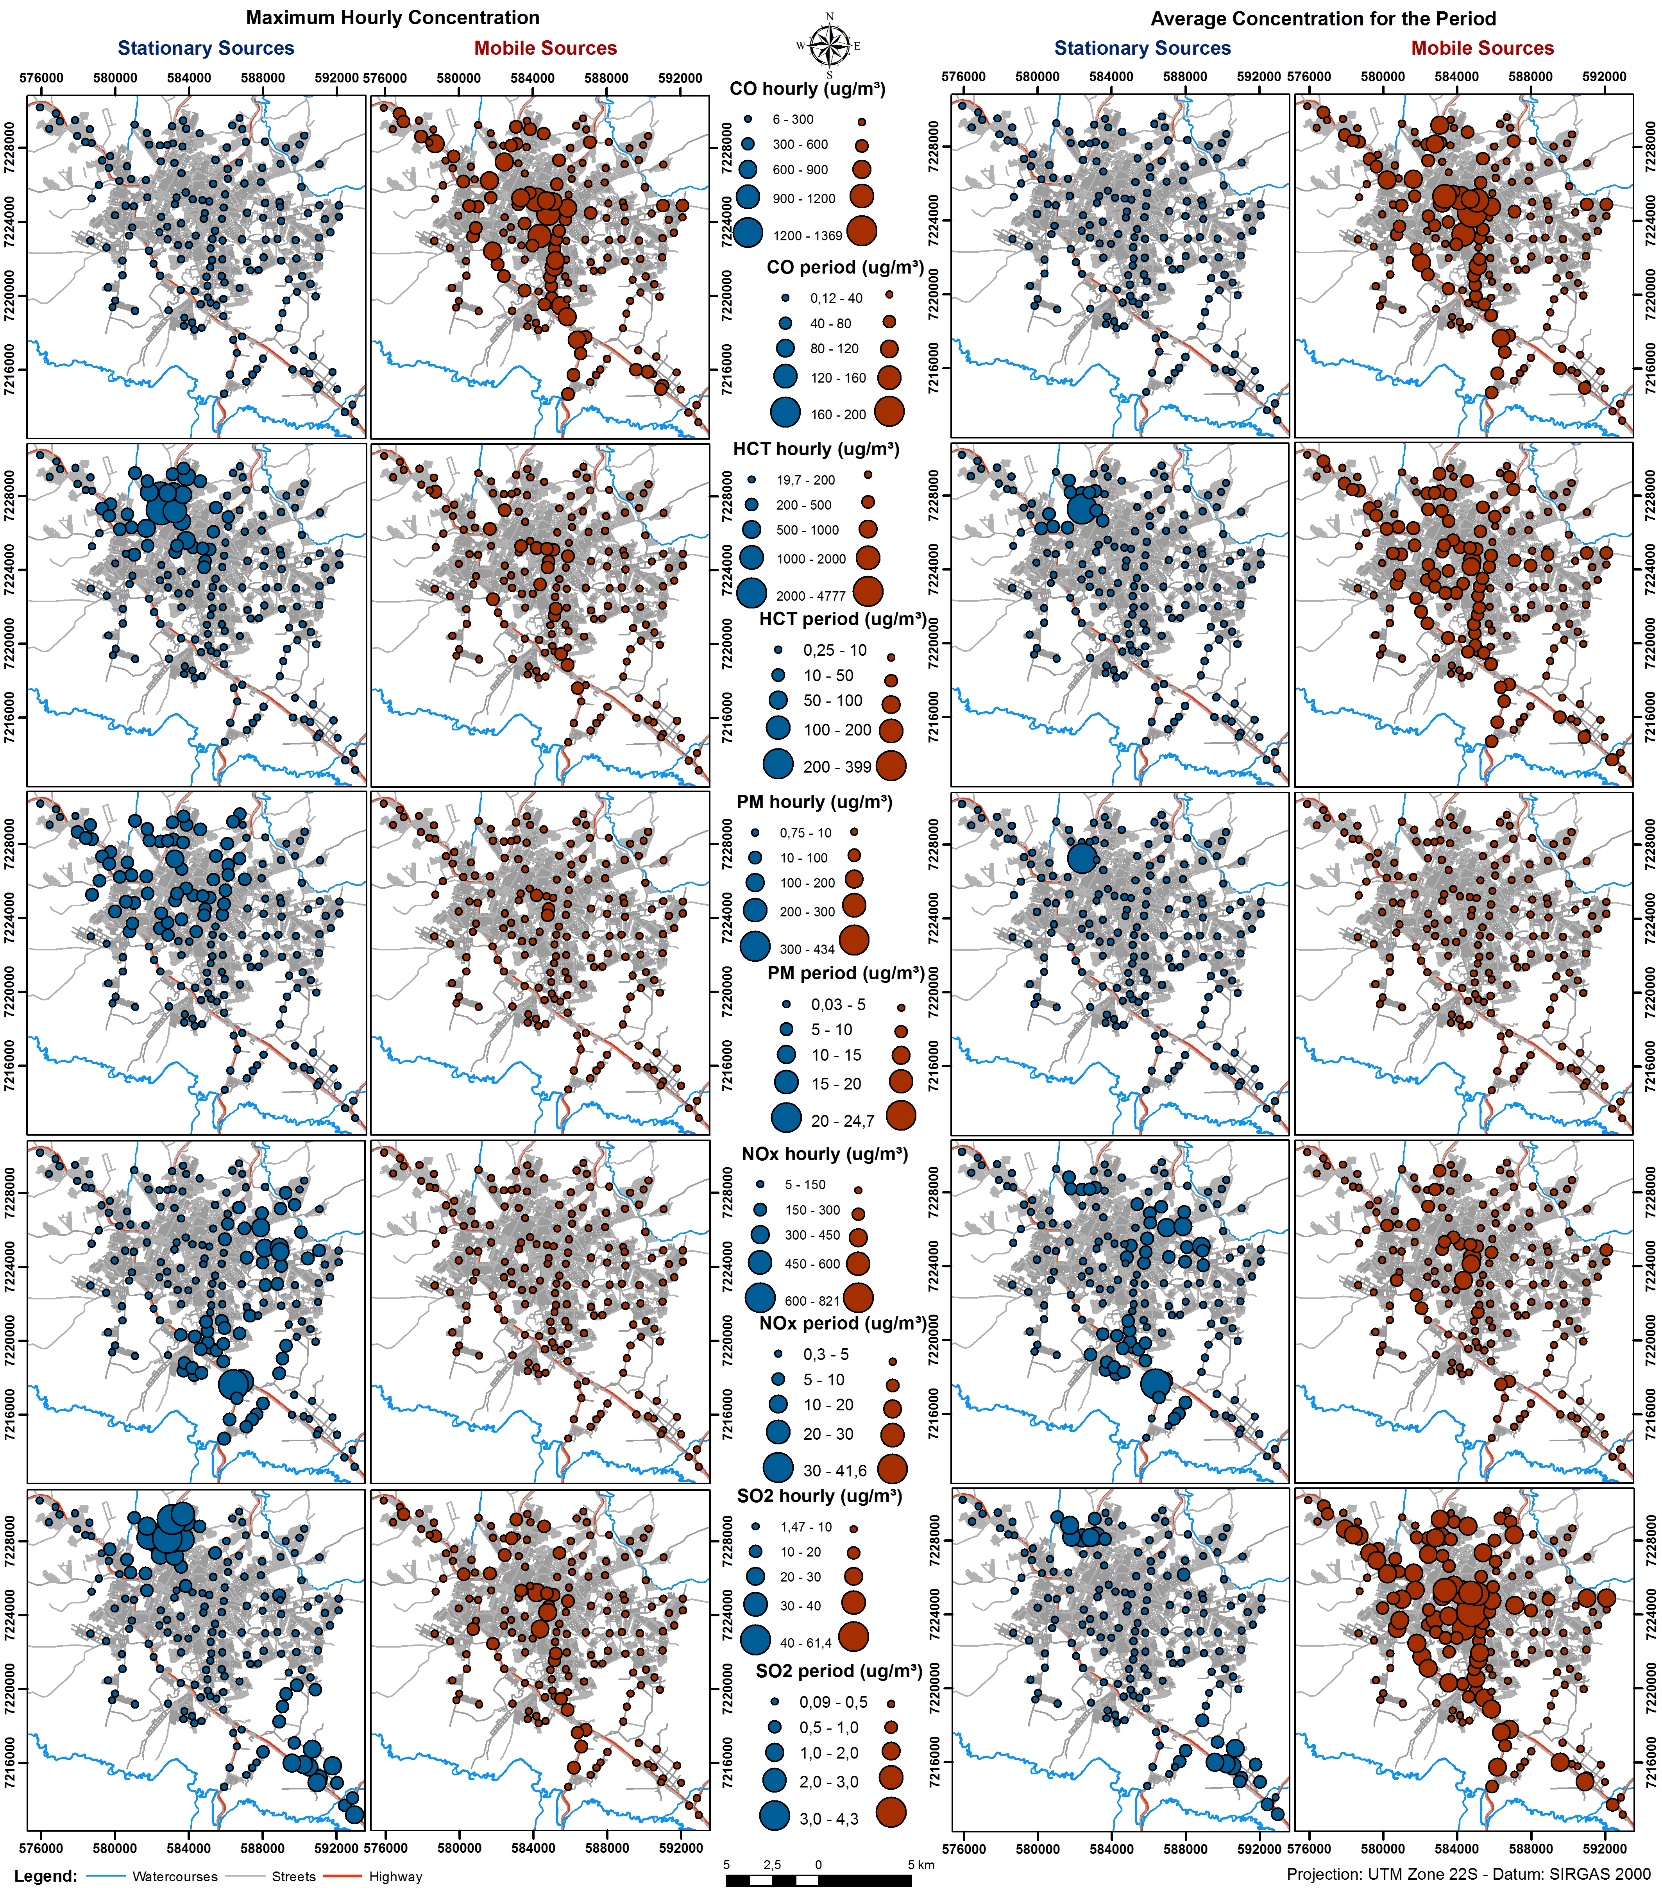
For nitrogen oxides, there is a greater contribution from stationary sources, especially those related to agribusiness and food. The point of highest concentration was located near the emission source. Although there were other fixed emission sources of this pollutant, its concentration at discrete receptors was not significant. Thus, a gradual reduction in NOx concentration is observed with distance from emission sources. For mobile sources, the city’s central region registers higher concentrations in the five-year average due to vehicle flow as well as proximity to fixed sources of some regions near highways that cut/surround the city.
Figure 3 shows two different situations for sulphur dioxide. In the hourly maximums, the largest contribution comes from point sources, with the highest concentrations located near points of emission. In the five-year period average, the highest contribution is from mobile sources with the highest concentrations located at city centre points and along the highways and avenues of intense vehicle flow.
The first two principal components obtained for modelled concentrations and bromeliad occurrence explained 60% of the data (Figure 4). In Figure 4, the circle size indicates the correlation obtained and the colours indicate the variable being correlated or grouped. The factor score presents the variables’ peaks witch were grouped in principal component. The higher the peaks, the greater the correlation, independent of being positive or negative.
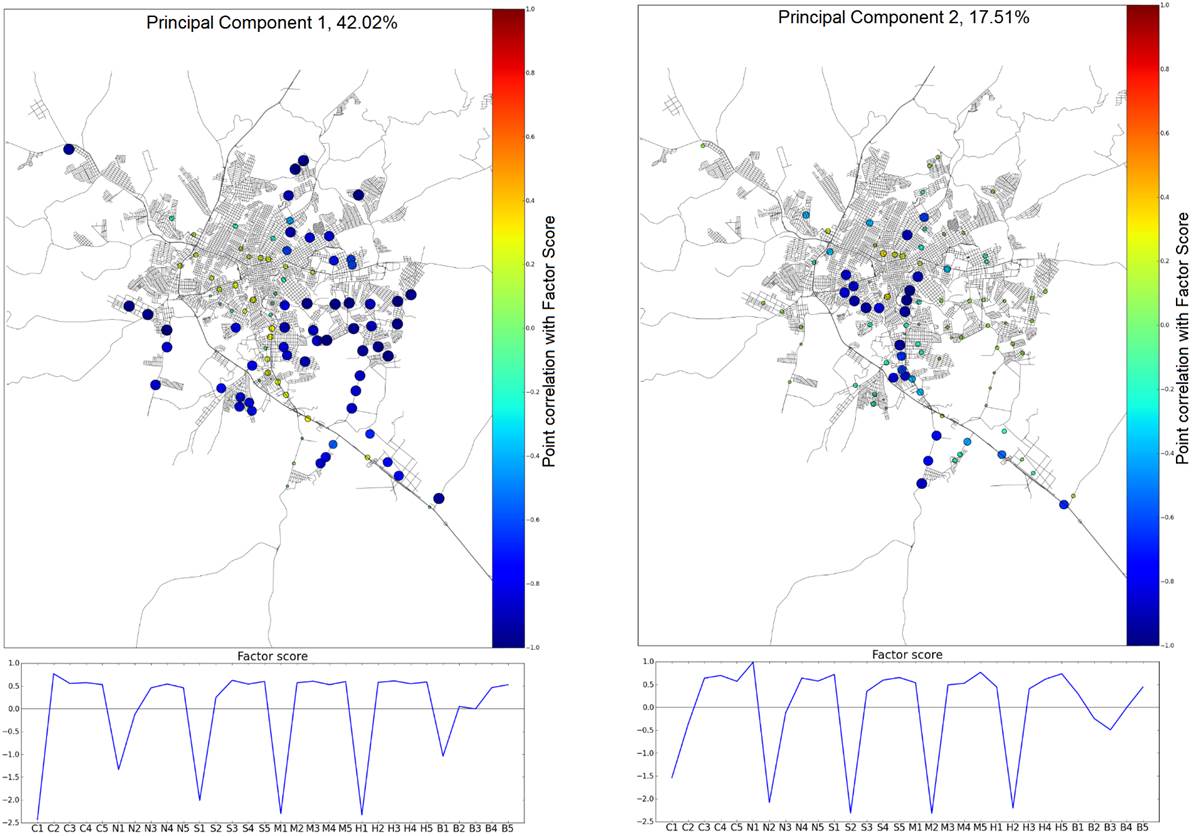
The first principal component explains more than 40% of the data. The main correlations occurred between the lower classes of pollutants, or those with the lowest concentrations, and the lowest class of bromeliad infestation. These highest correlations are highlighted in the south-central city region in the spatial analysis.
The second principal component accounts for approximately 17% of the data and together with the first, accounts for almost 60% of the variance. This component grouped the first class of CO with the second class of pollutants, NOx, SO2, PM and HCT, and the third class of the bromeliad infestation index.
It should be taking in to account that each principal component represents one variance result, witch means that explain how the data behaves in relation to the total value. The principal component analysis is highly dependent of the data input and the classes adopted. The error on this analysis is associated with the data input and it may diffuse in a multiplicative way until the result. In this study, five classes were used, so any change in these classes might affect the result.
Using spatial analysis major correlations are observed in the main access to the city centre from the highway in the south and in some points in the western region of the city’s urban area. This result indicates a correlation between pollutants and bromeliad infestation in a region with greater vehicular emissions than industrial emissions.
If nutrient demand is a factor of extreme importance for the growth of this species, plants present in the distribution network can benefit from the dust raised by vehicle traffic and grow faster. The intense vehicle traffic, especially of trucks, not only releases gases from the combustion but also creates air vortices that circulate taking dust from the ground to the plants. The association of light, water and nutrients, without any of the limiting factors (excess or lack of water, lack of nutrients, shade) being observed, creates the perfect microenvironment for such plants to develop in the electric power distribution network.
5. Conclusion
For the evaluation of the correlation between atmospheric pollutants and bromeliad occurrence in electric network structures was compared field data about the bromeliad infestation and the pollutants concentration by atmospheric dispersion modelling. The results present that there is a correlation between atmospheric pollutants and bromeliad infestation in the electric power distribution network. The correlation is more prominent among the lower classes of pollutants, or those with the lowest concentrations, and the lowest bromeliad infestation class.
In addition, results indicate a correlation between pollutants and bromeliad infestation in regions with greater vehicular emissions than industrial emissions in the city of Ponta Grossa, Paraná, Brazil. These regions are in the city centre and along the highways and avenues of greater flow. However, it is not possible to isolate the vehicle contributions from the industrial ones.
This finding is in agreement with the conclusions obtained by Santos [3], because there is a relationship between vehicle emissions and the occurrence of bromeliads in the electric power distribution network. It is also in agreement with Piazzetta [6]; the presence of T. recurvata is indicative of air quality change because it is not significantly impacted by the addition of substances to the atmosphere, but occurs in greater abundance in these areas and accumulates substances proportionally.
Acknowledgements
The authors would like to thank the Brazilian National Electric Energy Agency (ANEEL) and Copel Distribuição S. A. for funding the research and developing the project that includes this work. They also thank the contributions of the other researchers involved in the project.
References
[1] M. El-Harbawi, “Air quality modelling, simulation and computational methods: a review,” Environmental Reviews, vol. 21, no. 3, pp. 149-179, May 2013. View Article
[2] R. Reitz, Bromeliads and the endemic malariabromeliad, Itajaí, Brazil: Herbário Barbosa Rodrigues, 1983. (in Portuguese)
[3] J. J. S. Santos, “Study of Tillandsia spp (Bromeliaceae) epiphytes in electric power distribution lines of Curitiba,” M.S. thesis, Institute of Technology for Development, Curitiba, Brazil, 2014. (in Portuguese)
[4] A. B. Abril and E. H. Bucher, “A comparison of nutrient sources of the epiphyte Tillandsia capillaris attached to trees and cables in Cordoba, Argentina,” Journal of Arid Environments, vol. 73, no. 3, pp. 393-395, Mar. 2009. View Article
[5] S. Wester and G. Zotz, “Growth and survival of Tillandsia flexuosa on electrical cables in Panama,” Journal of Tropical Ecology, vol. 26, no. 1, pp. 123- 126, Jan. 2010. View Article
[6] K. D. Piazzetta, “Evaluation of potential of Tillandsia recurvata (L.) L., Bromeliaceae, as bioindicator of urban air pollution,” (in Portuguese), M.S. thesis, Federal University of Technology, Paraná, Curitiba, Brazil, 2015.
[7] M. E. Puente and Y. Bashan, “The desert epiphyte Tillandsia recurvata harbours in nitrogen-fixing bacterium Pseudomonas stutzeri,” Canadian Journal of Botany, vol. 72, pp. 406-408, 1994. View Article
[8] J. Barrat, “Study reveals hazards of the high-wire life for bromeliads,” Bromeliana, vol. 49, no. 7, pp. 1-4, Oct. 2012.
[9] D. H. Benzing and J. Sheemann, “Nutritional piracy and host decline: a new perspective on the epiphytehost relationship,” Selbyana, vol. 2, no. 2/3, pp. 133- 148, Sep. 1978.
[10] F. K. Claver, J. R. Alanis and D. O. Caldis, “Tillandsia spp.: epiphytic weeds of trees and brushes,” Forest Ecology and Management, vol. 6 no. 4, pp. 367-372, Oct. 1983. View Article
[11] E. Schrimpff, “Air pollution patterns in two cities of Colombia, S. A. according to trace substances contented of an epiphyte (Tillandsia recurvata L.),” Water, Air, and Soil Pollution, vol. 21, no. 1, pp. 279-315, Jan. 1984. View Article
[12] G. M. A. Bermudez, J. H. Rodriguez and M. L. Pignata, “Comparison of the air pollution biomonitoring ability of three Tillandsia species and the lichen Ramalina celastri in Angentina,” Environmental Research, vol. 109, no. 1, pp. 6-14, Jan. 2009. View Article
[13] A. Z. Garcia, C. M. Coyotzin, A. R. Amaro, D. L. Veneroni, L. C. Martínez and S. G. Iglesias, “Distribution and sources of bioaccumulative air pollutants at Mezquital Valley, Mexico, as reflected by the atmospheric plan Tillandsia recurvata L.,” Atmospheric Chemistry and Physics, vol. 9, no. 17, pp. 6479-6494, Sep. 2009. View Article
[14] M. L. Pignata, G. L. Gudino, E. D. Wannaz, R. R. Plá, C. M. González, H. A. Carreras and L. Orellana, “Atmospheric quality and distribution of heavy metals in Argentina employing Tillandsia capillaris as a biomonitor,” Environmental Pollution, vol. 120, no. 1, pp. 59-68, Nov. 2002. View Article
[15] E. D. Wannaz, H. A. Carreras, C. A. Pérez and M. L. Pignata, “Assessment of heavy metal accumulation in two species of Tillandsia in relation to atmospheric emission sources in Argentina,” Science of the Total Environment, vol, 361, no. 1-3, pp. 267- 278, May 2006. View Article
[16] H. A. Carreras, E. D. Wannaz and M. L. Pignata, “Assessment of human health risk related to metals by the use of biomonitors in the province of Córdoba, Argentina,” Environmental Pollution, vol. 157, no. 1, pp. 117-122, Jan. 2009. View Article
[17] J. H. Rodriguez, S. B. Weller, E. D. Wannaz, A. Klumpp and M. L. Pignata, “Air quality biomonitoring in agricultural areas nearby to urban and industrial emission sources in Córdoba province, Argentina, employing the bioindicator Tillandsia capillaris,” Ecological Indicators, vol. 11, no. 6, pp. 1673-1680, Nov. 2011. View Article
[18] E. D. Wannaz, H. A. Carreras, G. A. Abril and M. L. Pignata, “Maximum values of Ni2+, Cu2+, Pb2+ and Zn2+ in the biomonitor Tillandsia capillaris (Bromeliaceae): Relationship with cell membrane damage,” Environmental and Experimental Botany, vol. 74, pp. 296-301, Dec. 2011. View Article
[19] E. D. Wannaz, H. A. Carreras, J. H. Rodriguez and M. L. Pignata, “Use of biomonitors for the identification of heavy metals emission sources,” Ecological Indicators, vol. 20, pp. 163-169, Sep. 2012. View Article
[20] S. Goix, E. Resongles, D. Point, P. Oliva, J. L. Duprey, E. Galvez, L. Ugarte, C. Huayta, J. Prunier, C. Zouiten and J. Gardon, “Transplantation of epiphytic bioaccumulators (Tillandsia capillaris) for high special resolution biomonitoring of trace elements and point sources deconvolution in a complex mining/smelting urban context,” Atmospheric Environment, vol. 80, pp. 330-341, Dec. 2013. View Article
[21] M. A. Martínez-Carrillo, C. Solís, E. Andrade, K. Isaac-Olivé, M. Rocha, G. Murillo, R. I. BeltránHernández and C. A. Lucho-Constanyino, “PIXE analysis of Tillandsia usneoides for air pollution studies at an industrial zone in Central Mexico,” Microchemical Journal, vol. 96, no. 2, pp. 386-390, Nov. 2010. View Article
[22] C. A. Nogueira, “Air pollution evaluation of metals in the metropolitan region of São Paulo using the bromeliad Tillandsia L. usneoides as biomonitor,” Ph.D. dissertation, Institute of Nuclear and Energetics’ Researches, University of São Paulo, São Paulo, Brazil, 2006. (in Portuguese)
[23] A. F. Godoi, R. H. M. Godoi, R. Azevedo and L. T. Maranho, “Pollution and the vegetation density: BTEX in some public areas of Curitiba-PR, Brazil,” Química Nova, vol. 33, no. 4, pp. 827-833, Mar. 2010. (in Portuguese)
[24] A. M. G. Figueiredo, C. A. Nogueira, M. Saiki, F. M. Milian and M. Domingos, “Assessment of atmospheric metallic pollution in the metropolitan region of São Paulo, Brazil, employing Tillandsia usneoides L. as biomonitor,” Environmental Pollution, vol. 145, no. 1, pp. 279-292, Jan. 2007. View Article
[25] N. A. Vianna, D. Gonçalves, F. Brandão, R. P. Barros, G. M. A. Filho, R. O. Meire, J. P. M. Torres, O. Malm, A. D. O. Júnior and L. R. Andrade, “Assessment of heavy metals in the particulate matter of two Brazilian metropolitan areas by using Tillandsia usneoides as atmospheric biomonitor,” Environmental Science and Pollution Research, vol. 18, no. 3, pp. 416-427, Mar. 2011. View Article
[26] U. S. EPA, (2004, September), AERMOD: Description of Model Formulation. [Online]. Available: https://www3.epa.gov/scram001/7thconf/aermod/aer mod_mfd.pdf.