International Journal of Environmental Pollution and Remediation (IJEPR)
ISSN: 1929-2732

Volume 6 - Year 2018 - Pages 25-31
DOI: 10.11159/ijepr.2018.003
A Comparison of Antimony in Natural Water with Leaching Concentration from Polyethylene Terephthalate (PET) Bottles
Mihyun Jo1, Taeyuel Kim1, Sirim Choi1, Jongpil Jung1, Hee-il
Song1, Hyunjin Lee1,
Gyoungsu Park1, Jogyo Oh1, Jai-young Lee2
1Gyeonggi Province Institute of Health and Environment, North branch, Drinking Water Inspection Team
1 Cheongsaro, Uijeongbu-si, Gyeonggi-do, Republic of Korea 11780
jomh@gg.go.kr
2University of Seoul, Environmental Engineering
163 Seoulsiripdaero, Dongdaemun-gu, Seoul, Republic of Korea 02504
leejy@uos.ac.kr
Abstract - Antimony (Sb) is one of the trace hazardous compounds in drinking water. We investigated Sb concentration on natural environment such as river, reservoir, groundwater and raw water for bottled water. The natural content of Sb in northern Gyeonggi province in South Korea showed range from 0.00~1.64 μg/L. The average of Sb in 47 brands of bottled water was 0.57 μg/L on market. As a results of leaching experiment, was leached from polyethylene terephthalate(PET) bottles under storage condition at 35, 45 and 60 ℃. Sb concentration was increased from 1.04 to 9.84 μ g/L under 60 ℃ after 12weeks. UV-ray irradiation to bottled water not significantly induced antimony leaching for 14days.
Keywords: Antimony, Leaching, Polyethylene Terephthalate (PET), Bottled Water.
© Copyright 2018 Authors - This is an Open Access article published under the Creative Commons Attribution License terms Creative Commons Attribution License terms. Unrestricted use, distribution, and reproduction in any medium are permitted, provided the original work is properly cited.
Date Received: 2017-10-22
Date Accepted: 2018-01-25
Date Published: 2018-03-21
1. Introduction
Antimony (Sb) is one of the trace hazardous components in drinking water. Polyethylene terephthalate (PET) widely used to container for bottled water. Antimony trioxide (Sb2O3) is one of the most important catalysts widely used for solid-phased poly condensation of PET. It offers high catalytic activity, does not induce undesirable color, and has a low tendency to catalyse side reactions [1]. Polyethylene terephthalate (PET) has wide acceptance for use in direct contact with food, can be recycled and can be depolymerized to its monomer constituents [2]. In a recent study of Sb in bottled water in Europe and Canada, it was shown that the water become contaminated during storage because of Sb leaching from PET [3]. People tend to bottled water in cars for weeks or months. The temperature in car can reach to 75℃ at ambient temperature of 33℃in summer [4]. It can be expected that storage at high temperature may enhance contaminant release into water from PET bottles [5]. The bottled water market is continuously growing amount up from 2.1 million ton of 2004 to 3.5 million ton of 2013 in South Korea [6]. Especially, our institute has concerned safety of bottled water for customer. Because there are 62% of manufacturing plants for bottled water located in Gyeonggi province in South Korea.
Recommended standard for tap water have regulated 20 μg/L of Sb since 1998 in Korea. Recently, recommended standard for bottled water regulated in 2014 that should be inspected within 15 μg/L. Europe Union, World Health Organization, United States and Japan also have drinking water standards for Sb at 5 μg/L, 20 μg/L, 6 μg/L and 2 μg/L, respectively[7,8,9,10]. Bottles made using PET typically contain 100~300 of mg/kg Sb in the plastic. In contrast to bottles, Sb is found at natural environment from rocks, groundwater and river. Concentrations of Sb in crustal rocks is about 0.3 mg/kg and pristine groundwater and surface water normally range from 0.1 to 0.2 μg/L[11]. The International Agency for Research on Cancer (IARC) was classified as possibly carcinogenic to humans; Group 2B. It can cause nausea, vomiting and diarrhea when exposed MCL in short periods. The exposure of long term elevated Sb can lead to increased blood cholesterol and decreased blood sugar [12].
The objective of this study was to investigate Sb concentration in natural environment such as source water from river or reservoir, tap water, natural springs, raw water for bottled water. Next, brands of bottled water on market were collected and analysed. Then, Sb content was compared between natural water and PET bottled water.
Finally, the Sb leaching experiments for PET bottled water were conducted according to storage duration, temperature and ultraviolet (UV) to know amount of migration Sb from PET bottles into drinking water.
2.Materials and Methods
2.1. Sb Concentration in Natural Environment
Natural Sb contents were investigated for source water from river or reservoir and tap water in 15 of water supply plants, groundwater from 50 of mineral springs located in northern Gyeonggi province in South Korea. The raw water for bottled water sampled from 54 of intake holes in 13 of bottled water manufacturer plants in northern Gyeonggi province. Sb concentration was analysed by inductively coupled plasma-mass (Bruker aurora, Germany).
2.2. Investigation of Sb Concentration in PET Bottled Water and Comparison with Raw Water for Bottled Water
To investigate leaching effect of Sb into water of PET bottles, 47 commercial brands of PET bottled water were collected in market include domestic manufactured products and imported products The domestic products, imported water and deep sea water were 35, 7 and 7 bottles respectively. And then Sb concentration was compared with PET bottled water which was produced on that day and raw water for bottled water sampling in 54 intake holes.
2.3. Leaching Experiment in PET Bottled Water
The PET bottled water stored in 4, 21, 35, 45 and 60℃ for 12weeks used two bottles for each temperature. Sb concentration was analysed for every 2 weeks during that period. Polypropylene (PP) and glass bottles were used for control sample to compare to leaching amounts of Sb from PET bottles. Next, PET bottled water stored for 2, 6, 12, 24, 36, 48hrs, 3, 7, 9, 12, 14 days under ultraviolet (UV)-ray. Control samples were PP bottles and glass bottles. pH of bottled water at 6-8 poses no effect on Sb release [12]. Therefore, leaching experiment for pH influence was not conducted.
2.4. Leaching Rate of Sb under Ambient Condition
The Sb concentration for 50 brands of bottled water was analysed under room temperature and natural sunlight after six months. Because boxes of bottled water before reaching customers were mostly stored in uncontrolled storage, yard in country. PET bottled water can easily expose in sunlight and no constant temperature. That’s why we conducted leaching experiment under ambient condition. Initial concentration of Sb was analysed in June of 2016 and then after six month checked later concentration.
2.5. Power Function Model on Temperature-and Time-Dependant for Sb Leaching
The results of leaching experiment for temperature used to calculate in power function model. The rate of change in leaching was best fit by a power rather than by first- or second order reaction kinetics with respect to Sb [12]. The equation of power function model was presented in Eq. 1 as:
C = a [time]k
The a is the fitted initial Sb concentration a is the fitted initial Sb concentration (C, ppb) at time zero and k is a temperature-dependent power function constant. Time is in hours.
2.6. Estimation of Exposure Time to Reach Standard Concentration in PET Bottles
When PET bottles place in high temperature condition, it is needed to know how many times to reach standard concentration. Estimated exposure time was from Eq.2 [12] as:
Time(days) = ([STD ppb]/Sb0)1/k
The Sb0 was initial concentration when PET bottles stored in 60℃. k was power function model exponent which was plotted by temperature and time dependent relation for Sb leaching. STD ppb was concentration for each nation such as South Korea (15ppb), Europe (5ppb), U.S. (6ppb) and Japan (2ppb).
3. Results
3.1. Natural Sb Concentration for Source and Tap Water in Water Supply Plants
Natural Sb concentration in source water from river or reservoir in fifteen water supply plants was 0.13 μg/L of average. The average of tap water also indicated same value at 0.13 μg/L of average. Although natural concentration was very low to not enough to compare variation of concentration, it means that treatment process to be tap water might be to not influence Sb concentration. In Korea, the recommended standard of Sb content for tap water is 20 μg/L. The average of tap water in northern Gyeonggi area was 0.65% compared to the standard. Figure 1 indicated natural Sb concentration in source water and tap water from fifteen water supply plant located in northern Gyeonggi area. HR, SW and GP plants were located in Gypeong. GY and IS plants were located in Goyang. Most of samples showed approximately 0.1 μg/L. Otherwise source water and tap water from MS plant located in Paju city had higher concentration than others. Sb in source water was 0.72 μg/L and tap water showed 0.84 μg/L. In previous study, typical concentration of dissolved Sb in unpolluted water is less than 1 μg/L [13].
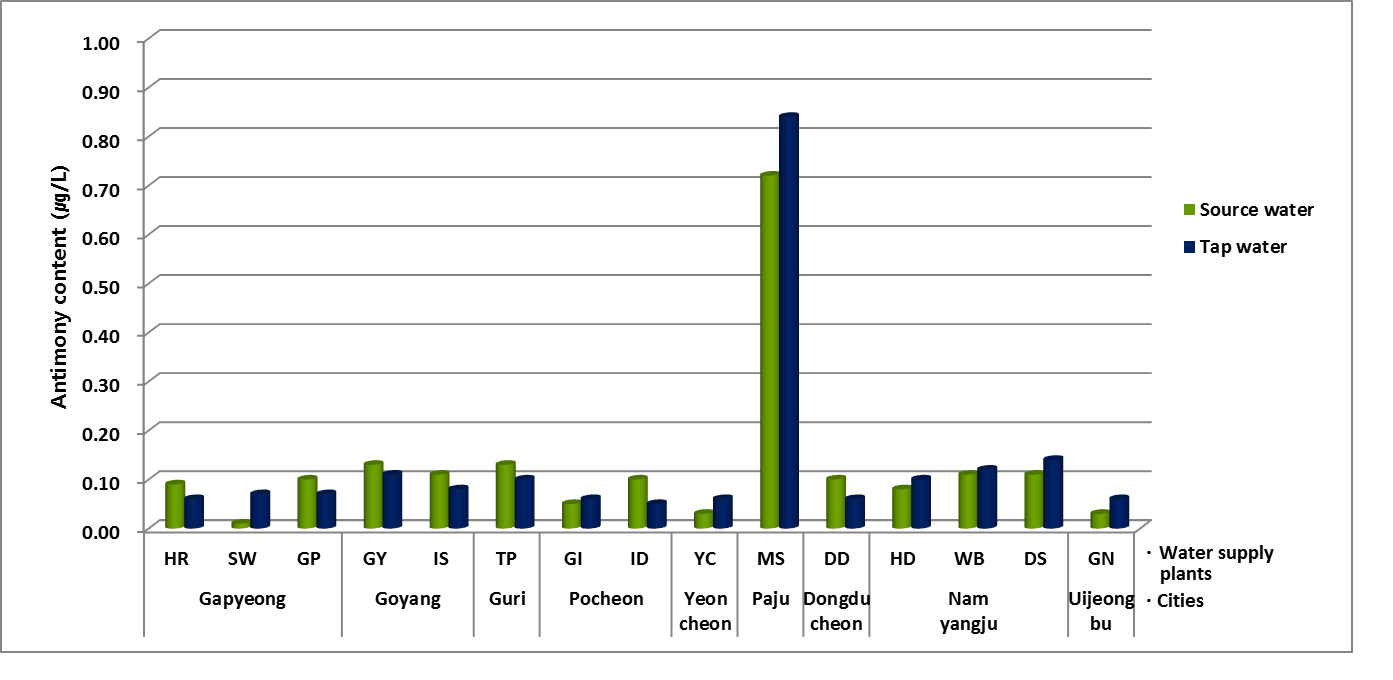
Table 1. The water supply plants located in northern Gyeonggi province.
| Region | Plant | Source | Capacity (1,000ton/day) |
| Gapyeong | HR | Groundwater | 7 |
| SW | Groundwater | 2 | |
| GP | Groundwater | 19 | |
| Goyang | GY | River | 250 |
| IS | Reservoir | 250 | |
| Guri | TP | River | 30 |
| Pocheon | GI | River | 1.7 |
| ID | Groundwater | 1.5 | |
| Yeoncheon | YC | River | 33 |
| Paju | MS | River | 96 |
| Dongdu cheon |
DD | River | 40 |
| Namyangju | HD | River | 55 |
| WB | Reservoir | 215 | |
| DS | River | 450 | |
| Uijeongbu | GN | River | 8 |
3.2. Natural Sb Concentration for Mineral Springs
The average of the drinking water from 50 mineral springs for each of 10 sites in 5 cities in northern Gyeonggi province was 0.02 μg/L that were 0.1 times lower than Sb average concentration of groundwater which was investigated by WHO. According to data from ministry of environment in Korea, Sb concentration for groundwater was 0.24 μg/L on average.
Figure 2 showed Sb concentration on average for mineral springs located in each city. These values were under 0.03 μg/L that was very low. There were 6 non-detected places among 50 mineral springs.
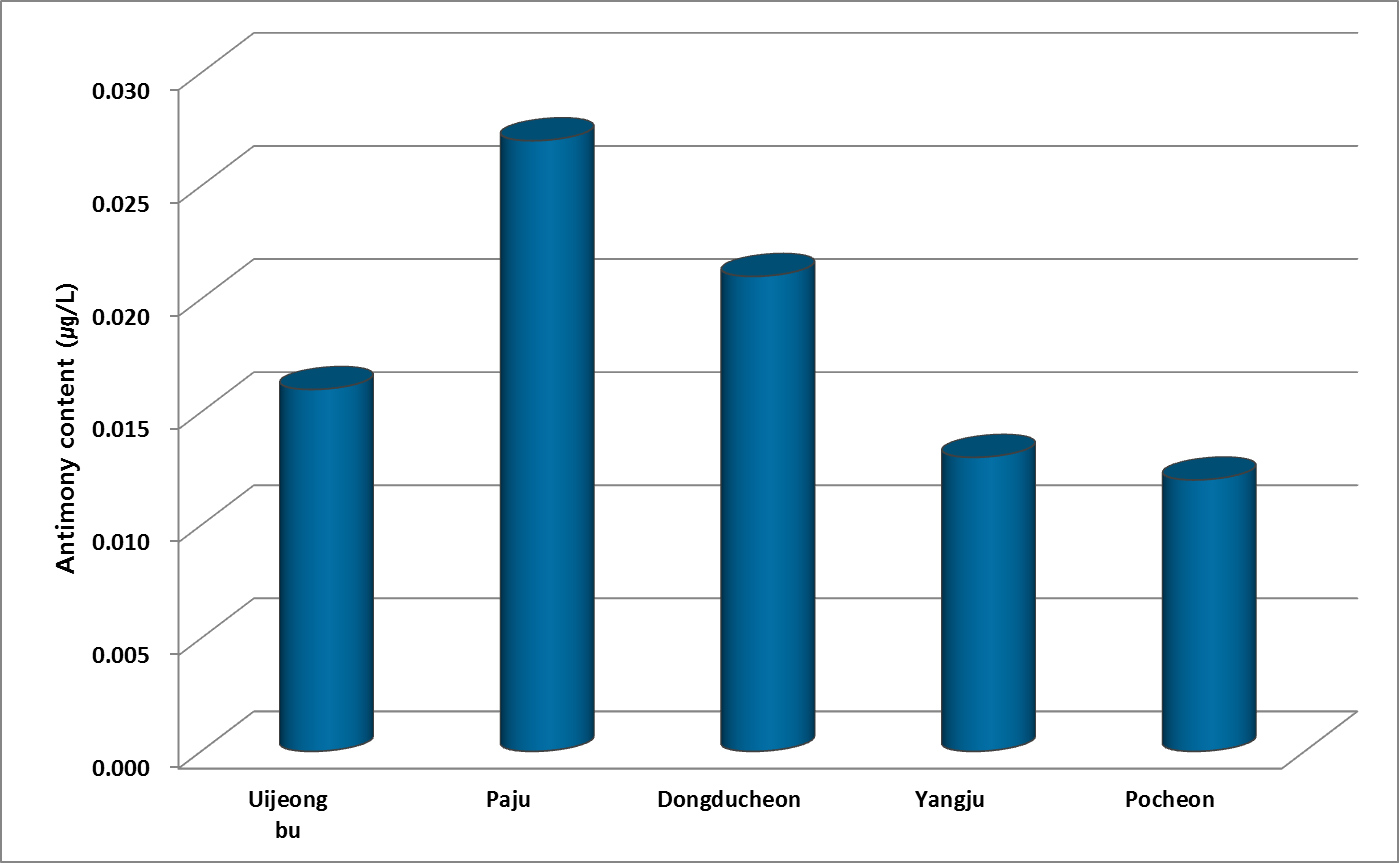
The Sb in source water from river-bed, surface water and reservoir was 0.13 μg/L. On the other hand, mineral springs showed 0.02 μg/L in northern Gyeonggi area. The Sb concentration in source water was 6.5 times higher than groundwater from mineral springs. Because the Sb might be to leached from soil and sediment with other metals in river.
3.3. Sb Concentration in Mineral Water for Bottled Water
We investigated mineral water from 54 intake holes of 13 bottled water manufacturing plants located in northern Gyeonggi province. Mineral water was draw aquifer up below approximately 200meter. Aquifer Detection rate of Sb was 90.7%. Average concentration in mineral water was 0.32 μg/L and maximum was 1.64 μg/L and there were 5 non-detected intake holes. Figure 3 has shown Sb concentration in mineral water sampled from 54intake holes. From A to M in graph mean each bottled water company and the numbers below these alphabet indicated how many intake holes had in that bottled water manufacturing plants.
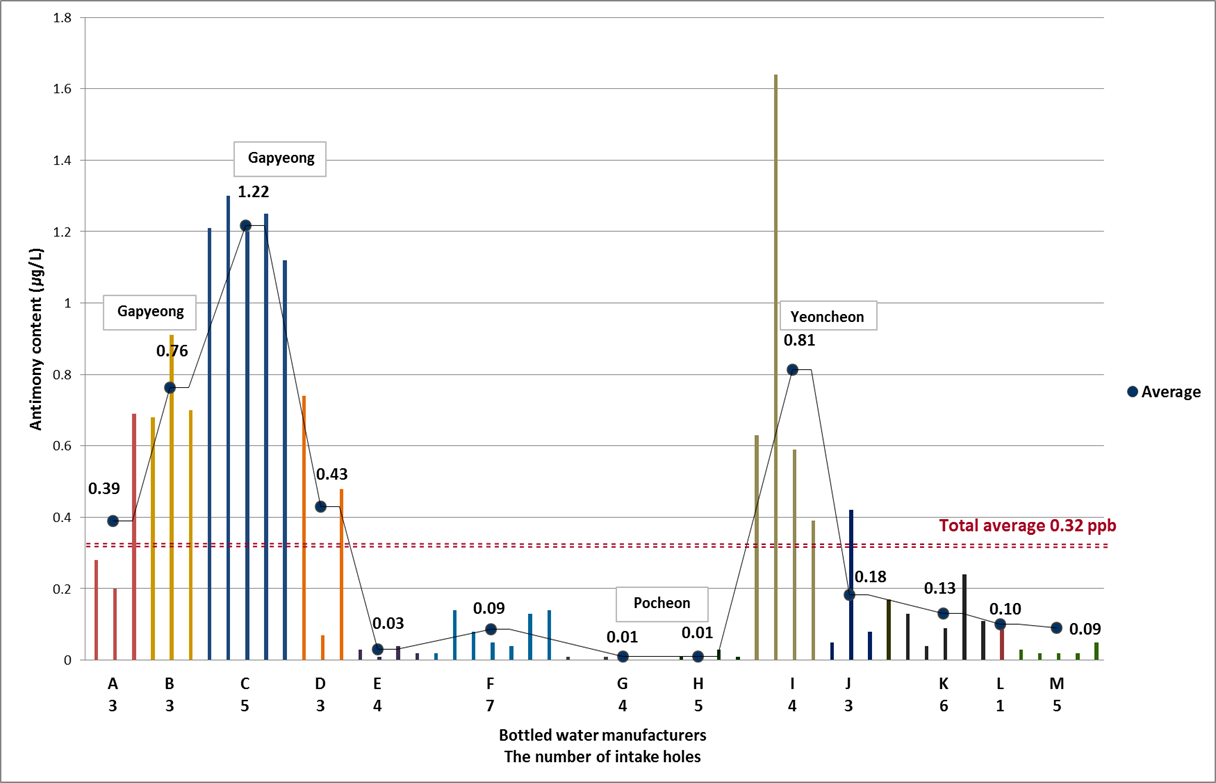
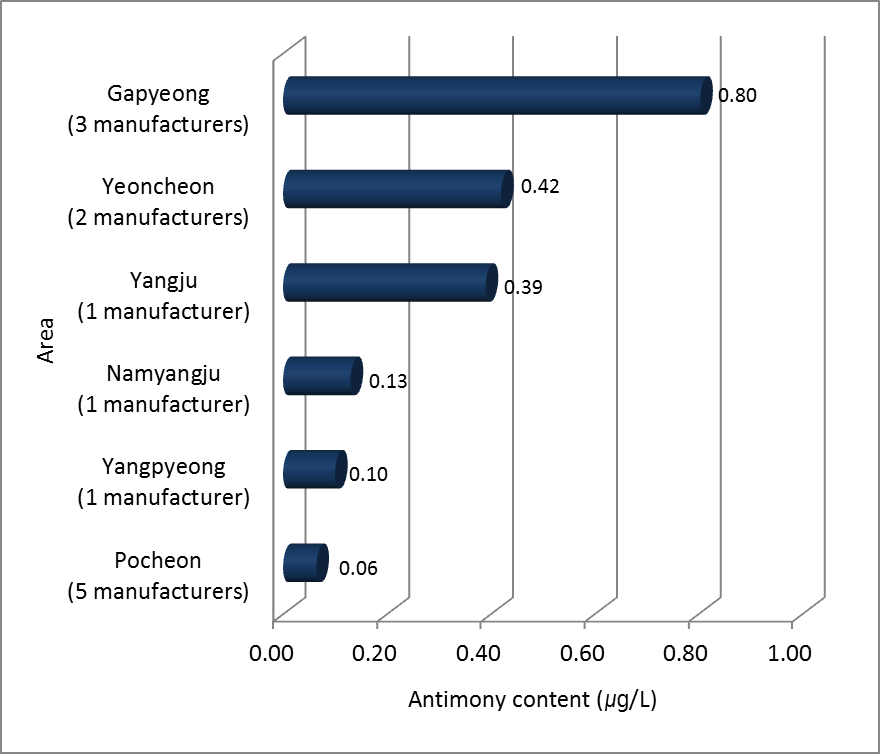
The C company located in Gapyeong had highest concentration of Sb. Average concentration for 5 holes was 1.22 μg/L. And then I company located in Yeoncheon showed 0.81 μg/L from 4 intake holes. Futhermore the highest value was shown at 1.64 μg/L sampled from second intake hole in I company. The G and H companies had the lowest concentration at 0.01 μg/L. As we reported that source water from river and reservoir included 0.13 μg/L of Sb. And Sb from mineral springs was 0.02 μg/L. The mineral water for bottled water had higher contents than source water and mineral springs. Figure 4 indicated median concentration of Sb in mineral water for each area in northern Gyeonggi area. The 3 bottled water manufacture plants located in Gapyeong had high value at 0.80 μg/L. The 5 companies located in Pocheon had lowest value at 0.06 μg/L. Therefore we have known Sb concentration was affected by properties of local area. So we tried to investigate geologic map for Sb to find more specific proof but there were no specific geologic information for Sb in Korea yet.
3.4. Sb Concentration for PET Bottled Water on Market
We collected 47 brands of PET bottled water in market. 35 products was domestic bottled water. Imported products were 7 and deep sea water was 7 products. Detection rate of Sb was 100% in these products, while the detection rate in mineral water from manufacturing plants was 90.7% . Total average concentration of 47 samples was 0.57 μg/L on the other hand mineral water was 0.32 μg/L. In Korea, the monitoring standard for Sb is 15 μg/L. Therefore the mean concentration in PET bottled water was 0.04% compare to 15 μg/L of monitoring standard to consider safe to drink.
Table 2. Sb concentration in brands of PET bottled water collected in market (μg/L).
| PET Bottled Water | Ave. | Max. | Min. | Total Ave. |
| Domestic (mineral water) |
0.75 | 1.09 | 0.12 | 0.57 |
| Imported (mineral water) |
0.55 | 1.08 | 0.19 | |
| Deep sea water | 0.41 | 0.65 | 0.27 |
Table 2 was shown that Sb concentration for 47 brands of PET bottled water collected in 5 markets. The PET bottled water was classified as three parts like domestic, imported mineral water and deep sea water. Because bottled water was divided into mineral water and deep sea water by law in Korea. Domestic brands of PET bottled water contained 0.75 μg/L and one of the products had 1.09 μg/L of Sb. And minimum concentration was 0.12 μg/L. In case of imported PET bottled water was 0.55 μg/L of average. Maximum and minimum values in imported samples were similar with domestic products. We guessed that imported PET bottled water would contain more Sb concentration than domestic ones because of the long transport time. However, the average of Sb domestic products got higher value. Deep sea water of bottled water contained lower concentration than mineral water of bottled water.
3.5. Sb Leaching Experiment from PET Bottled Water According to Time and Temperature
Sb leaching experiment was conducted by storing PET bottled water at 4, 21, 35, 45 and 60 ℃ for 12 weeks to analyse every two weeks. After 2weeks, it observed that Sb was leached from PET bottles at 35, 45 and 60 ℃. Figure 5 indicated leaching effects of Sb from PET bottles according to time and temperature.
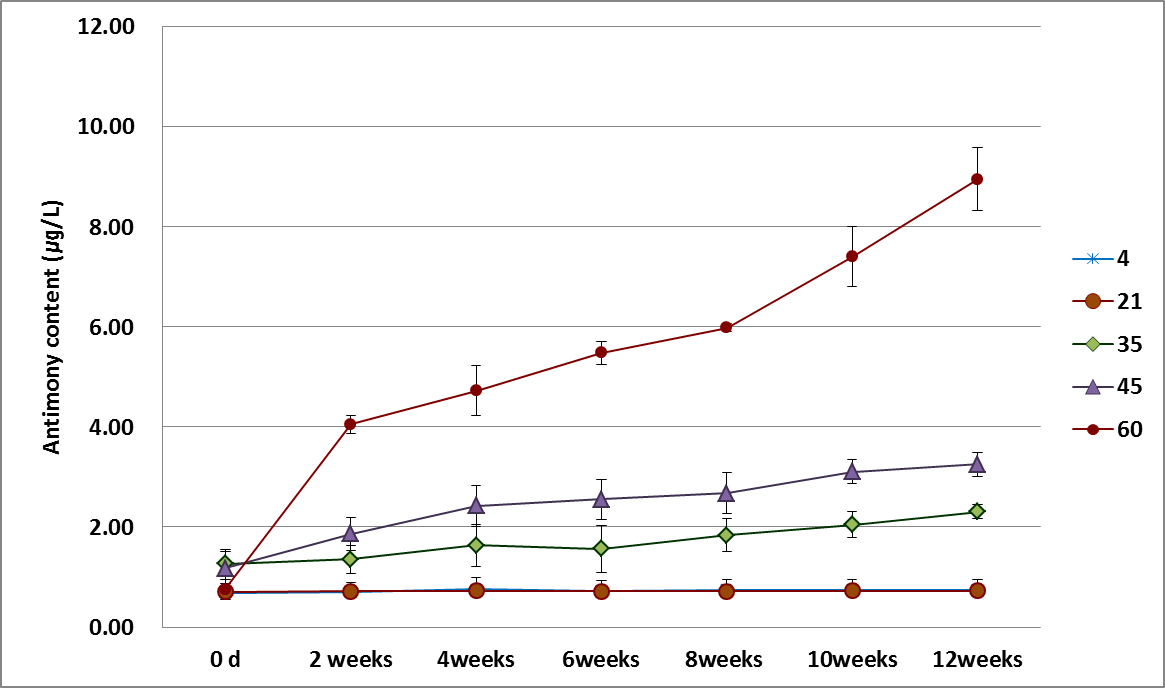
There were no change for concentration at 4 and 21 ℃ for 12weeks. However it was exposed that Sb was released from PET bottles after 2weeks at 35, 45 and 60 ℃. In case of storing 35 ℃ bottles, initial concentration of Sb was 1.6 μg/L and time goes by final concentration of Sb indicated 2.50 μg/L which was 1.6 times compare to before 12weeks. At 45 ℃ , initial Sb in PET bottle water was 1.71 μg/L and then after 12weeks it contained 2.1times contents. Finally, there are significant releasing effects from PET bottled water at 60 ℃ for every two weeks. After 2weeks, it observed significant increasing concentration of Sb from 1.04 μg/L to 4.31 μg/L to be 4.1 times leaching effects. After 12weeks, Sb was observed at 9.84 μg/L in PET bottled water.
3.6. Sb Leaching Experiment to Irradiate UV-Ray for PET Bottled Water
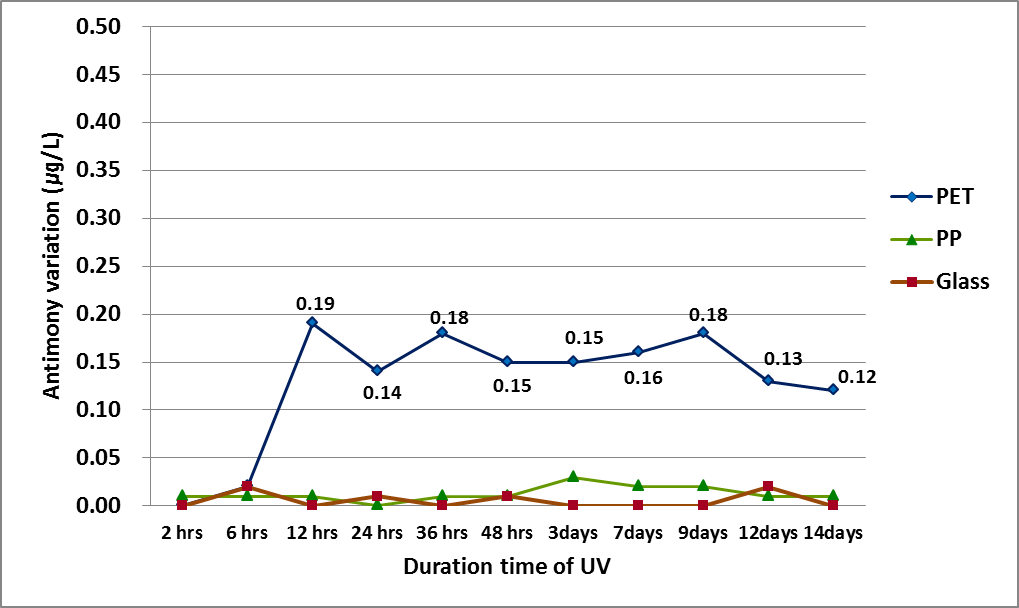
PET bottled water was exposed by UV-ray for 2, 6, 12, 24, 36 and 48hrs, 3, 7, 9, 12 and 14days respectively. As a result, releasing of Sb started to irradiate UV-ray after 6hrs. Figure 6 showed variation of Sb concentration in PET bottled water that indicated releasing amounts. After 6hrs, 0.19 μg/L of Sb was leached from PET bottled water. There were no significant changes of amount for releasing Sb as time goes by. It was founded that the Sb variation was similar range from 0.1 to 0.2 μg/L until 14days. And mean of variation was 0.16 μg/L. Therefore, Duration for UV-ray irradiation was not contributed to releasing Sb from PET bottles.
3.7. Leaching Rate of Sb under Ambient Condition from PET Bottled Water
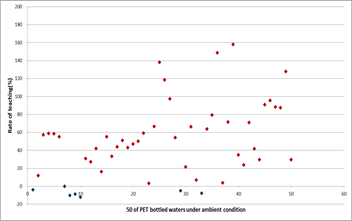
The results for Sb leaching experiment for temperature and UV-ray were mentioned above sections. Also, Sb leaching rate under ambient condition was observed from June of 2016 to December of 2016. The 50 brands of PET bottled water were store in room temperature for six months. Because most consumers would put PET bottled water in part of the kitchen or terrace. Figure 7 showed the leaching rate of Sb. 43 PET bottled water of the 50 samples were observed for releasing Sb. Most samples indicated 20~60% of leaching compare to initial concentration. Maximum leaching rate was approximately 160%.
3.8. Sb Leaching Applied for Power Function Model on Temperature-And Time-Dependant
The rate of antimony leaching was correlated by a power function model [10]. So, we also calculated equation of Eq.1 using results of leaching experiment for Sb at 35, 45 and 60℃. Table 3 indicated value for k and R 2 for each temperature. All of R2 were over 0.90 so we knew that this studies for leaching Sb also got well fitted with power function model.
Table 3. The results of power function model for Sb leaching experiment for exposure time.
| Exposure time(℃) | a | k | R2 |
| 35 | 1.60 | 0.0587 | 0.91 |
| 45 | 1.71 | 0.0978 | 0.97 |
| 60 | 1.04 | 0.2953 | 0.93 |
3.9. Estimation of Exposure Time to Reach Standard Concentration in PET Bottles
We calculated the expected exposure time to reach standard concentration for standards for each country in case of PET bottled water stored in 60℃. The Eq.2 was used for estimation and Sb0 was 1.04 μg/L. The k value was 0.93 indicated in Table 3. In case of South Korea, the Sb concentration will reach to 15 μg/L of recommended standard after 350days. The 15.7 days were needed to reach 6 μg/L of standard in U.S. The 8.5 days of exposure time can exceed 5 μg/L of standard in Europe. And, 9.2 hours were required to reach 2 μg/L of recommended standard in Japan.4. Conclusions
In the northern Gyeonggi province of South Korea, natural concentrations of antimony was investigated in 13 of water supply plants for source water from river or reservoir and tap water were range from 0.01~0.84 μg/L and mean was 0.13 μg/L for both source water and tap water. 50 mineral springs for public showed 0.02 μg/L that were very low to not need to be worry. And mineral water for bottled water which contained 0.32 μg/L on average to be investigated from 54 intake holes in 13 bottled water manufacturing plants. As a result of 47 brands of PET bottled water, average concentration of Sb was 0.57 μg/L. and detection rate was 100%. Otherwise detection rate of mineral water was 90.7%. PET bottled water brands, the average value was 0.57 μg/L and detection rate was 100%. Otherwise detection rate of raw water to bottled water showed 90.7%. Sb in PET bottled water contained higher concentration than natural water such as river, mineral springs, mineral water for bottled water. As a result of leaching experiment for PET bottled water, releasing of Sb was revealed temperature-dependent. Sb concentration from PET bottled water in 35, 45 and 60℃ started to increase after 2weeks. The leaching amount was rapidly increased till 9.84 μg/L after 12weeks in 60℃, though, it was less than recommended standard in Korea. However UV-ray irradiation to bottled water for 14days induced increasing antimony release into water very slightly that variation for Sb concentration was constant from 0.1 to 0.2 μg/L. Therefore we realized that it needed to store the PET bottled water in storage condition to maintain 4, 21℃. High temperature can induce leaching Sb from PET bottled water.
References
[1] B. Duh, “Effect of antimony catalyst on solid-state polycondensation of poly (ethylene terephthalate),” Polymer, vol. 43, pp. 3147-3154, 2002. View Article
[2] W. A. MacDonald, “New advances in poly(ethylene terephthalate) polymerization and degradation,” Polymer International, vol. 51, no. 10, pp. 923-930, 2002.
[3] W. Shotyk, M. Krachler and B. Chen, “Contamination of canadian and european bottled waters with antimony leaching from PET containers,” Journal of Environmental Monitoring, vol. 8, no. 2, pp. 288-292, 2006. View Article
[4] R. Manning and J. Ewing, “Temperature in Cars survey,” pp. 1-21, 2009.
[5] Y. Y. Fan, J. L. Zheng, J. H. Ren, J. Luo, X. Y. Cui and L. Q. Ma, “Effects of storage temperature and duration on release of antimony and bisphenol A from polyethylene terephthalate drinking water bottles of China,” Environmental Pollution, vol. 192, pp. 113-120, 2014. View Article
[6] Ministry of Environment, Environmental statistics yearbook. R. K., 2015, pp. 125.
[7] CEC, “Council directive relating to the quality of water intended for human consumption,” 80/778/EEC, 1980.
[8] WHO, Guidelines for drinking-water, 3rd ed., vol. 1, recommendations, 2006, pp. 305. View Report
[9] USEPA, “National primary drinking water standards,” U.S., 2009.
[10] W. Hiroshi, “Revision of drinking water standards in Japan,” Japan, 2003, pp. 84.
[11] H. J. M. Bowen, “Environmental chemistry of the elements,” London, Academic Press, 1979.
[12] P. Westerhoff, P. Prapaipong and A. Hillaireau, “Antimony leaching from polyethylene terephthalate(PET) plastic used for bottled drinking water,” Water Research, vol. 42, pp. 551-556, 2008.View Article
[13] B. Nelson, C. Yu-Wei, I. Occurrence and F. Montserrat, “Antimony in the environment: a review focused on natural waters,” Earth-Science Reviews 57, pp. 125-176, 2002. View Article