International Journal of Environmental Pollution and Remediation (IJEPR)
ISSN: 1929-2732

Volume 6 - Year 2018 - Pages 10-24
DOI: 10.11159/ijepr.2018.002
Effects of Operation Parameters on Heavy Metallic Ion Removal from Mine Waste by Natural Zeolite
Amanda L. Ciosek, Grace K. Luk
Department of Civil Engineering, Faculty of Engineering and Architectural Science, Ryerson University
350 Victoria Street, Toronto, Ontario, Canada M5B2K3
amanda.alaica@ryerson.ca; gluk@ryerson.ca
Abstract - This study investigates the effects of particle size (0.420-1.1410 mm), dosage (40, 80 g/L), influent concentration (total 10 meq/L, 400 mg/L), contact time (5-180, 270, 360 min), set-temperature (20-32oC), and heat pre-treatment (200, 400, 600 oC) of natural zeolite on the removal efficiency of heavy metallic ions (HMIs); lead (Pb2+), copper (Cu2+), iron (Fe3+), nickel (Ni2+), and zinc (Zn2+). The sorption process is performed in batch mode with a 100 mL aqueous solution, acidified to a pH level of 2 with concentrated nitric (HNO3) acid. For all experimental parameter conditions examined, the removal efficiency order follows: Pb2+>>Fe3+>Cu2+>Zn2+>Ni2+; the zeolite mineral exhibits the greatest preference towards the Pb2+ ion in all parameter trends. Overall, the removal efficiency is increased with decreasing particle size, as well as increasing dosage, contact time, and set-temperature. The operation is influenced by the studied parameters in the order of: influent concentration > heat pre-treatment level > dosage > particle size > contact time > set-temperature.
Keywords: Natural Zeolite, Heavy Metallic Ions, Sorption Capacity, Removal Efficiency.
© Copyright 2018 Authors - This is an Open Access article published under the Creative Commons Attribution License terms. Unrestricted use, distribution, and reproduction in any medium are permitted, provided the original work is properly cited.
Date Received: 2017-08-17
Date Accepted: 2018-01-29
Date Published: 2018-02-07
1. Introduction
Waterways are prone to acid mine drainage (AMD) contamination caused by the discharge of mineral mining and processing effluent [1,2]. Characterized by low pH levels and the presence of heavy metallic ions (HMIs) and other toxic elements [2], AMD significantly threatens our health and environment, causing various diseases and disorders [3-5]. The process of sorption has attained the interest of the mining industry as an industrial wastewater treatment method [6,7]. The uptake of HMIs is attributed to both adsorption (on the surface of the sorbents’ micropores) and ion-exchange (through the sorbents’ framework pores and channels) mechanisms [8]; referred to as sorption as a unified treatment process [9,10].
Natural zeolites have progressed among researchers’ interests [6,11]. The mineral’s structure is comprised of three independent components [11-13]: (1) hydro-aluminosilicate crystalline structure of SiO4 and AlO4 tetrahydras linked by oxygen atoms, (2) interconnected void spaces in a framework containing exchangeable cations, and (3) zeolitic water present at 10-20% of the dehydrated phase of the natural zeolites’ structure. Its open, homogenous microporous negatively charged three-dimensional framework of voids and channels [11] enables the exchange with cations present when in solution [1,14]. Clinoptilolite, a globally abundant and well-documented form of zeolite [13], is used in this research. One of the most significant properties of zeolite is its high cation exchange capacity (CEC), and it is considered as a strong candidate for the removal of wastewater contaminants [15].
The industry holds great interest in the physico-chemical influential factors that dictate sorption efficiency of zeolite; which include particle size, initial concentration, pH level, and contact time. A smaller particle size of the sorbent material provides greater contact surface area, which improves the performance of the sorption process [5,16]; which may be attributed to diffusion as the rate-limiting step of the overall ion-exchange mechanism in the sorption process [16]. The effect of the dosage (solid-mass-to-solution-volume) on the uptake of HMIs is well-established. An increase in dosage translates to an increase in the rate of uptake; although the amount sorbed per unit mass decreases, there is a higher availability of active sorption sites which sorb more HMIs from the solution [1].
The initial concentration of the ions influences the removal efficiency due to the availability of functional groups on the specific surface to bind with the HMIs. This is primarily the case at higher concentrations, demonstrating a higher overall uptake given that the concentration difference is the driving force to overcome mass transfer resistance to metal ion transport between the solution and the sorbent surface [5]. The pH level influences the dissociation of the sorbent and solution chemistry, and affects the surface charge of the sorbents and degree of ionization of different pollutants [5]. This influence of acidity is particularly the case for HMIs that are in a rather low preference by zeolite; the initial pH must be attentively selected to ensure a balance among all ionic species. The goal is to avoid precipitation; for once precipitated, the ions of interest cannot be sorbed [16].
The state of equilibrium is altered throughout the sorption process. Room temperature is preferred for analysis, although higher thermal treatment temperatures are assumed to enhance sorption capacity with increased surface activities and solute kinetic energy [1,5], by removing the ‘zeolitic water’ present in the framework [1]; however, the dehydration of zeolite is an endothermic process, thereby causing ‘activation’ of the material [12] to a certain threshold, after which may lead to the structural collapse of the mineral [1].
The contact time is an important factor in the relationship of pollutants and sorbents. The rapid uptake of pollutants and equilibrium is established in a specific and limited period, which demonstrates efficiency of the sorbent for treatment. The mechanism study conducted by Sprynskyy et al. [4] states that the sorption of HMIs by natural zeolite is a heterogeneous process with three distinct stages: (1) rapid uptake within the first 30 min of contact, (2) inversion due to desorption prevalence, and (3) slower increase in uptake. In the kinetic studies conducted by Motsi et al. [1], the initial stage of rapid adsorption occurs within the first 40 contact min; when all of the adsorption sites are available for cations to interact, and when the concentration difference between the influent stock and sorbent–solution interface is very high. Inglezakis et al. [14] tributes this period to ion-exchange in the micropores on the zeolite particles’ surface. The predominance of desorption is most likely caused by slower diffusion of exchangeable cations within the internal zeolite crystalline structure, and consequently these preferred ions occupy the available exchange positions on the zeolite surface. During the third stage, the gradual deceleration of sorption in the micropores is caused by poor access as well as by more intensive sorption in comparison to the particles’ surface. All of these factors are significant towards establishing the performance of any sorbent material [5].
The composition of AMD is uniquely complex and contains numerous contaminants, which include heavy metals and other pollutants, and the presence of these in solution affect the overall removal potential [2,9]. The existence of HMIs in AMD is mine-specific, and the concentrations fluctuate extensively [17]. This is evident in the vast variations of expected HMI levels, such as: copper, iron, zinc, aluminum, and manganese at 0.17, 0.82, 101.2, 22.6, and 10.7 mg/L, respectively [18]; copper, iron, zinc, aluminum, manganese, arsenic, and cadmium at 12, 200, 85, 15, 15, 9 and 1 mg/L, respectively [1]; or lead, copper, iron, zinc, nickel, aluminum, manganese, arsenic and cobalt at 0.045, 5.4, 4.9, 11.5, 0.145, 32.8, 8.1, 0.004 and 0.269 mg/L, respectively [19]. In addition to HMIs, other AMD constituents, such as the variations in minerals, micro-organisms, and (weather and seasonal) temperatures, all influence the quality and quantity of AMD [19]. A majority of previous research on sorption capacity of zeolite has investigated synthetic simple solute solutions spiked in single-component systems [20], and have demonstrated greater removal performance compared to investigating actual AMD [1,20]. However, there is still limited knowledge of the sorption capacity by zeolite for heavy metals and the associated mechanisms when in various multi-component systems [14,21]. The synthetic simple heavy metal solution permits the analysis of the effects of the selected operation parameters in a controlled environment for improved quantification, and identification of the important trends in this study.
The authors have designed a four-phase research project, which investigates: (1) the effects of preliminary parameters and operative conditions (particle size, sorbent-to-sorbate dosage, influent concentration, contact time, set-temperature, and heat pre-treatment), (2) HMIs component system combinations and selectivity order with a focus on its effects on the removal of lead (Pb2+) [22], (3) kinetic modelling trends [23], and (4) the design of a packed, fixed-bed, dual-column sorption treatment system [24]. The study presented in this paper refers to the first phase. In feasible treatments of industrial waste, it is essential to classify the degree of influence of each operational parameter on the overall system performance [17]. Therefore, the objective of this present study is to assess the sorption capacity of natural zeolite for the removal of five fundamental HMIs, specifically lead (Pb2+), copper (Cu2+), iron (Fe3+), nickel (Ni2+), and zinc (Zn2+) [18,25], combined in various component systems. The operative conditions of zeolite particle size and dosage, HMI influent concentration, contact time, set-temperature and heat pre-treatment level are all investigated. This is of great importance, in order to harness the full potential of zeolite in tertiary treatment processes.
2. Methodology
2. 1. Materials and Equipment
2. 1. 1. Heavy Metallic Ion Influent Concentration
The removal efficiency order indicates the variation of the selectivity for each HMI [16]. Overall, this selectivity or preference of zeolite for one cation compared to another [26] is stronger for the counter-ion of higher valence, increasing with dilution of solution and strongest with ion-exchange of high internal molality [16]. Therefore, comparative analysis of various HMIs should be conducted at the same normality and temperature [16]; as executed in this study. The synthetic ion solutions are prepared from analytical grade nitrate salts of Pb(NO3)2 (CAS No. 10099-74-8), Cu(NO3)2·3H2O (CAS No. 10031-43-3), Fe(NO3)3·9H2O (CAS No. 7782-61-8), Ni(NO3)2·6H2O (CAS No. 13478-00-7), and Zn(NO3)2·6H2O (CAS No. 10196-18-6), respectively; dissolved in deionized distilled water. The metals are combined to maintain a total normality of 0.01N (10 meq/L) [14,16] in the following systems:
- single-component system–10 meq/L per metal (lead [Pb], copper [Cu], iron [Fe], nickel [Ni], zinc [Zn]),;
- dual-component system–5.0 meq/L per metal (lead-copper [Pb-Cu], lead-iron [Pb-Fe]),;
- triple-component system–3.3 meq/L per metal [T] (lead, copper and iron), and;
- multi-component system–2.0 meq/L per metal [M] (all five metals).
The corresponding HMI concentrations are approximately 1036 mg/L for Pb2+, 318 mg/L for Cu2+, 186 mg/L for Fe3+, 293 mg/L for Ni2+, and 327 mg/L for Zn2+. In addition to maintaining a total 10 meq/L concentration, the study is also conducted at 400 mg/L initial concentration for each HMI, based on the median range of conversion from meq/L to mg/L concentrations for a majority of the HMI investigated.
The Canada-Wide Survey of Acid Mine Drainage [17] reports a seasonal average of a majority of the mines surveyed to have documented pH values ranging from 2 to 5. Consequently, the influent stock is acidified with concentrated nitric acid (HNO3) (CAS No. 7697-37-2) to a pH level of less than 2 [27]. This study is conducted in the conservative manner, with a majority of the pH values documented to be below this reported average and within comparability. It is important to note that the mechanism of HMI uptake by natural zeolites is influenced by the pH level; shifting from ion exchange/adsorption in the acidic region to adsorption/complexation and possible precipitation in the basic region [28]. The neutralization increases the pH level to reach a threshold of solubility of the metal hydroxides; the removal may be partially attributed to precipitation (or sorption/co-precipitation) rather than just sorption [29]. With the use of highly soluble nitrate salts and by maintaining very low pH levels in the batch-mode configuration of all the experiments, the formation of inorganic ligands (such as OH–) is prevented and the precipitation of the HMIs is avoided [6,16]; under the testing conditions of this study.
Based on the dosage of zeolite mass to a selected 100 mL volume of aqueous solution, the HMI uptake is calculated by the following relationship [16]:
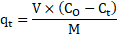
where ![]() is the HMI adsorbed at time
is the HMI adsorbed at time ![]() (in meq/g or mq/g),
(in meq/g or mq/g), ![]() and
and ![]() are the initial and final HMI
concentrations in solution (in meq/L or mg/L) after time
are the initial and final HMI
concentrations in solution (in meq/L or mg/L) after time ![]() ,
,
![]() is
the solution volume (in L), and
is
the solution volume (in L), and ![]() is the zeolite mass (in g).
is the zeolite mass (in g).
2. 1. 2. Natural Zeolite Mineral
This study employs a natural zeolite mineral sample composed primarily of 85-95% clinoptilolite (CAS No. 12173-10-3) and is sourced by a deposit located in Preston, Idaho [30]. This sample holds a cation exchange capacity of 180-220 meq/100 g, a pH level ranging from 7-8.64. It has a maximum water retention and an overall specific surface area of 55 wt% and 24.9 m2/g, respectively. The zeolite mineral sample is applied in its natural state, without any chemical modifications, to minimize associated costs and environmental impacts of the process investigated in this study. The particle size of the raw mineral sample ranges from 1.41 mm (pass No. 14) to 0.420 mm (retain No. 40). This sample is divided into sizes A (dp,A)(1.190-1.410mm), B (dp,B) (0.707-0.841 mm), and C (dp,C) (0.420-0.595 mm) with standard mesh sieves and a mechanical shaker (Model No. Humboldt H4330; CAT No. G118-H-4330). Size D (dp,D) (0.841-1.19 mm) has also been selected, ranging between A (pass No. 16) and B (retain No. 20). This additional size range holds the greatest percent yield within the +14-40 source and also, being a broader, coarser size range, is of interest to this study. Overall, these four divisions are selected to provide a distinct variance, based on the approximate distribution of the +14-40 source, as displayed in Table 1. The particles are put through a cleaning cycle, which involves thoroughly rinsing in deionized distilled water to remove residual debris and dust, and drying at 80 + 3oC for 24 hr (Isotemp® Oven Model 630G; Serial No. 30300047; CAT No. 13-246-630G; 115 V; 6.5 A; 60 Hz; Fisher Scientific, USA) to remove residual moisture [31].
Table 1. Preliminary Distribution of Zeolite Supply.
| Test Sample Size (g) | 1006.60 | ||
| Sieve Gradations | Sample Distribution | ||
| (g) | (%) | ||
| #14 Retain | 76.5 | 7.6 | |
| A | #14 Pass | #16 Retain | 199.9 | 19.9 |
| D | #16 Pass | #18 Retain | 181.1 | 18.0 |
| #18 Pass | #20 Retain | 150.9 | 15.0 | |
| B | #20 Pass | #25 Retain | 119.1 | 11.8 |
| #25 Pass | #30 Retain | 94.0 | 9.3 | |
| C | #30 Pass | #35 Retain | 68.1 | 6.8 |
| #35 Pass | #40 Retain | 48.3 | 4.8 | |
| #40 Pass (PAN) | 57.9 | 5.8 | |
| SUM | 995.8 | 98.9 | |
| LOST | 10.8 | 1.1 | |
2. 1. 3. Analytical Equipment
Quantitative observations are conducted by analyzing the HMI concentrations in their aqueous phase with Inductively Coupled Plasma – Atomic Emission Spectroscopy (ICP-AES) technology (Optima 7300 DV, Part No. N0770796, Serial No. 077C8071802, Firmware Version 1.0.1.0079, Perkin Elmer Inc.), with corresponding WinLab32 Software (Version 4.0.0.0305). This spectrometry technique is considered to have true multi-element performance with exceptional sample throughput, and with a very wide range of analytical signal intensity [32]. The primary wavelengths of each HMI element analyte targeted are 327.393 (Cu), 238.204 (Fe), 231.604 (Ni), 220.353 (Pb), and 206.200 (Zn), respectively; selected on the basis that these wavelengths have the strongest emission and provide the best quantifiable detection limits. With the plasma setting in radial view (to concentrations of greater than 1 mg/L), auto sampling of 45 seconds normal time at a rate of 1.5 mL/min, and a processing setting of 3 to 5 points per peak with 2 point spectral corrections are applied.
The calibration curve is generated through ‘linear calculated intercept’ by applying a stock blank and a multi-element Quality Control Standard 4 with 1, 10, 50, 90, and 100 mg/L concentrations (as per Standard Methods Part 3000) [27]. Based on the corresponding influent concentrations in mg/L, the samples are diluted with deionized distilled water, by zero to four pre-determined 50% steps, in order to be within this calibration range. The sorbed amount of HMI is calculated based on the initial concentration and its 0.45 µm filtered supernatant concentration.
Triplicate readings and their mean concentrations in calibration units are generated in mg/L by the ICP-AES software. Three major check parameters are selected to evaluate the calibration quality during each ICP-AES analytical session. The triplicate concentration of the median 50-mg/L standard detects an average of 51.37 mg/L, which is within 5% of the known value. The percent relative standard deviation (%RSD) of this selected standard reports an average of 0.4944% (well within the ≤3% limit) and the correlation coefficient of each HMI analyte primary wavelength generates an average of 0.9997, which is very close to unity. These check parameters indicate that the calibration is of a reasonable level of accuracy and reliability [33], such that there is acceptable error associated with the experimental data.
2. 2. Experimental Design
All analyses are conducted in batch mode, combining the HMI solutions of various component systems to 100 mL (total 10 meq/L initial concentration) with 4 g of the zeolite sorbent mineral. The mixture is agitated on a bench-top orbital shaker with triple-eccentric drive (MaxQ™ 4450, CAT No. 11-675-202, ThermoFisher Scientific) at a controlled condition of 400 r/min set at 22oC, for a period ranging from 5 to 180 min. In all experiments, after reaction, HMI sorbate and zeolite sorbent are separated through a 0.45 μm syringe filter. The hydrothermal pre-treatment is conducted by placing the cleaned zeolite into a pre-heated muffle furnace (NEY M-525 SII; Serial No. AKN 9403-108; 120 V; 50/60 Hz; 12.5 A; 1500 W; Barkmeyer Division, USA) at the three selected temperatures of 200oC, 400oC, and 600oC [1], for 1-hr. Table 2 summarizes the parameters investigated to determine their influence of the overall removal of the selected HMIs.
Table 2. Operation Parameters and Conditions.
| Parameter | Conditions |
| Particle Size | Single-Component Systems: [Pb], [Cu], [Fe], [Ni], [Zn] A 1.140-1.190mm (pass No. 14, retain No. 16) B 0.707-0.841mm (pass No. 20, retain No. 25) C 0.420-0.595mm (pass No. 30, retain No. 40) |
| Dosage |
Single-Component Systems: [Pb], [Cu], [Fe], [Ni], [Zn] Particle Size: D 0.841-1.19 mm Dosage: 4 g/100 mL, 8 g/100 mL |
| Influent Concentration |
Systems: [Pb], [T], [M] Particle Size: D Concentrations: total 10 meq/L, 400 mg/L |
| Contact Time |
Systems: [Pb], [Pb-Cu], [Pb-Fe], [T], [M] Particle Size D: 0.841-1.19 mm Contact Time: 180, 270, 360 min |
| Set-Temperature |
Systems: [T], [M] Particle Size: D Contact Time: 180 min Set Temperature: 20oC, 24oC, 28oC, 32oC |
| Heat Pre-Treatment |
Systems: [Pb], [T], [M] Particle Size: D Heat Pre-Treatment: 200oC, 400oC, 600oC |
3. Results and Discussion
3. 1. Particle Size and Dosage
The particle size and dosage parameters are significant to this study, as well as to the industry that adopt sorption as a treatment method. Figure 1 displays the uptake of each HMI at 180 min of contact with zeolite. As expected, with a reduction in the particle size (dp) from A to C, the uptake and percent removal increases. This trend is most prevalent for the HMI Pb2+, with a 45.63% decrease in concentration or a 15.18% increase in uptake from dp,A (0.1872 meq/g) to dp,B (0.2157 meq/g). However, this trend is not as prevalent from dp,B to dp,C, with only a 3.98% in improved HMI uptake. This may be due to the greater particle size gradation range between dp,A and dp,B specifically, as well as a 40.47% decrease in nominal geometric mean diameter of 1.30 mm (dp,A) to 0.77 mm (dp,B). Based on the sieve distribution presented in Table 1, an average of 10% per mesh range was detected for particle sizes B and C. In order to eliminate skater/variability, and to maintain a controlled environment, the particle size selected to observe the other experimental parameters is between A and B, denoted hereon in as size D (dp,D). Based on these initial observations in the removal trends by particle size, the dp,D is considered a more feasible and conservative range moving forward; with a nominal geometric mean diameter of 1.00 mm [34].
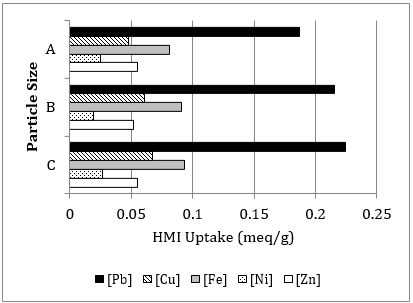
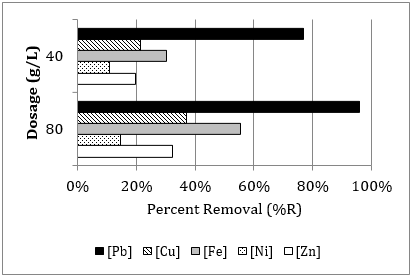
Figure 2 displays the overall percent removal of each HMI (in single-component solutions) at 180 min of contact with natural zeolite by increasing the zeolite sorbent dosage from 4 g to 8 g, for every 100 mL of HMI sorbate volume. As illustrated, when the dosage increases (doubled), the percent removal increases substantially; which is attributed to higher site uptake availability [35]. At a contact time of 180 min, the HMI effluent concentration is reduced for Cu2+ at 19.91%, Fe3+ at 35.93%, and significantly for Pb2+ at 82.37%. Additionally the overall removal efficiency of the selected dp,D falls within the range achieved of dp,A and dp,B; demonstrating experimental continuity.
Kinetic modelling is a powerful tool to assess the
performance of sorbent materials and to comprehend the fundamental mechanisms
involved in the sorption process. The sorption rate depends on the amount of
ions on the sorbent surface at time![]() and what is sorbed when an equilibrium state is
reached. The models are classified as either reaction-type or diffusion-type (film, intra-particle) [35]; both models have been thoroughly investigated
and have demonstrated strong correlation [35-38].
and what is sorbed when an equilibrium state is
reached. The models are classified as either reaction-type or diffusion-type (film, intra-particle) [35]; both models have been thoroughly investigated
and have demonstrated strong correlation [35-38].
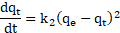
The reaction-type known
as the pseudo-second-order (PSO) kinetic model has well-demonstrated this rate
process of various contaminants, including metal ions and organic substances in
an aqueous state [36,39]. This model implies that the rate-limiting step
is by chemical adsorption (chemisorption). It is represented in Eq. (2) and by
applying the boundary conditions of ![]() and
and ![]() , its
linearized form is presented in Eq. (3) [4,7,36,38]:
, its
linearized form is presented in Eq. (3) [4,7,36,38]:

where ![]() is
the initial sorption rate (in meq/g·min) as
is
the initial sorption rate (in meq/g·min) as ![]() approaches zero [38], and
approaches zero [38], and ![]() is
the PSO rate constant (in g/meq·min). These constants are determined by a plot
of the linearized form of
is
the PSO rate constant (in g/meq·min). These constants are determined by a plot
of the linearized form of ![]() versus
versus ![]() [36,38]. The PSO rate constants and correlation
coefficients are summarized in Table 3 and Table 4 for the particle size and
dosage parameters, respectively. Based on the linearized form of Eq. (3), the
slope (m) and y-intercept (b) values are interpreted to determine the
theoretical sorption at equilibrium (
[36,38]. The PSO rate constants and correlation
coefficients are summarized in Table 3 and Table 4 for the particle size and
dosage parameters, respectively. Based on the linearized form of Eq. (3), the
slope (m) and y-intercept (b) values are interpreted to determine the
theoretical sorption at equilibrium (![]() in
meq/g). The experimental sorption
at 180 min (
in
meq/g). The experimental sorption
at 180 min (![]() in
meq/g) of contact is also
presented.
in
meq/g) of contact is also
presented.
As demonstrated by the coefficients (CC), a strong correlation is established for
all HMIs for both parameters. For
all HMIs on average, the particle
size ![]() reaches
the theoretical
reaches
the theoretical ![]() uptake
of 92.27% for dp,A, 86.93% for dp,B, and 93.45% for dp,C; the dosage
uptake
of 92.27% for dp,A, 86.93% for dp,B, and 93.45% for dp,C; the dosage ![]() reaches the theoretical
reaches the theoretical ![]() uptake
on average of 84.27% for dosage 40 g/L and 80.72% for dosage 80 g/L. The
particle size uptake rate trends in Table 3 are systematically consistent; with
the
uptake
on average of 84.27% for dosage 40 g/L and 80.72% for dosage 80 g/L. The
particle size uptake rate trends in Table 3 are systematically consistent; with
the ![]() within 5% of the theoretical maximum 0.25 meq/g threshold for total HMIs.
within 5% of the theoretical maximum 0.25 meq/g threshold for total HMIs.
Table 3. PSO – Particle Size Data
| Size A | |||||
| System | CC | m | b | ||
| [Pb] | 0.1872 | 0.9840 | 4.374 | 216.46 | 0.2286 |
| [Cu] | 0.0476 | 0.8193 | 12.780 | 1445.40 | 0.0782 |
| [Fe] | 0.0813 | 0.9741 | 11.002 | 372.35 | 0.0909 |
| [Ni] | 0.0245 | 0.9141 | 31.057 | 969.75 | 0.0322 |
| [Zn] | 0.0548 | 0.7413 | 9.569 | 1420.10 | 0.1045 |
| Size B | |||||
| System | CC | m | b | ||
| [Pb] | 0.2157 | 0.9970 | 3.856 | 147.15 | 0.2594 |
| [Cu] | 0.0607 | 0.9866 | 13.611 | 626.99 | 0.0735 |
| [Fe] | 0.0908 | 0.9934 | 10.190 | 202.53 | 0.0981 |
| [Ni] | 0.0196 | 0.9872 | 47.121 | 298.41 | 0.0212 |
| [Zn] | 0.0514 | 0.9623 | 16.317 | 795.49 | 0.0613 |
| Size C | |||||
| System | CC | m | b | ||
| [Pb] | 0.2242 | 0.9964 | 3.783 | 110.79 | 0.2644 |
| [Cu] | 0.0674 | 0.9700 | 13.942 | 373.99 | 0.0717 |
| [Fe] | 0.0933 | 0.9976 | 10.067 | 155.73 | 0.0993 |
| [Ni] | 0.0263 | 0.9942 | 37.924 | 274.89 | 0.0264 |
| [Zn] | 0.0550 | 0.9646 | 17.211 | 430.21 | 0.0581 |
Table 4. PSO – Dosage Data.
| Dosage 40 | |||||
| System | CC | m | b | ||
| [Pb] | 0.1919 | 0.9926 | 4.098 | 217.01 | 0.2440 |
| [Cu] | 0.0533 | 0.9291 | 15.750 | 836.09 | 0.0635 |
| [Fe] | 0.0757 | 0.9708 | 11.872 | 419.08 | 0.0842 |
| [Ni] | 0.0268 | 0.9806 | 34.919 | 739.14 | 0.0286 |
| [Zn] | 0.0494 | 0.9147 | 15.237 | 1106.10 | 0.0656 |
| Dosage 80 | |||||
| System | CC | m | b | ||
| [Pb] | 0.1198 | 0.9986 | 7.343 | 174.00 | 0.1362 |
| [Cu] | 0.0463 | 0.9821 | 17.211 | 926.12 | 0.0581 |
| [Fe] | 0.0691 | 0.9899 | 12.893 | 344.90 | 0.0776 |
| [Ni] | 0.0184 | 0.9967 | 50.300 | 655.14 | 0.0199 |
| [Zn] | 0.0403 | 0.6369 | 13.507 | 1771.00 | 0.0740 |
The dosage level is not directly proportional to
the sorption removal efficiency. The removal efficiency of Pb2+ improves
from 76.82% to 95.91%; however, the ![]() uptake
has decreased from 0.1919 to 0.1198 meq/g, and the theoretically anticipated
uptake
has decreased from 0.1919 to 0.1198 meq/g, and the theoretically anticipated ![]() uptake at equilibrium decreases from 0.2440 to
0.1362 meq/g, comparing dosage 40 g/L to 80 g/L, respectively. This may be attributed
to the very rapid uptake of the first stage of sorption. The two HMIs
preferred by zeolite in this study exhibit a faster initial sorption rate (
uptake at equilibrium decreases from 0.2440 to
0.1362 meq/g, comparing dosage 40 g/L to 80 g/L, respectively. This may be attributed
to the very rapid uptake of the first stage of sorption. The two HMIs
preferred by zeolite in this study exhibit a faster initial sorption rate (![]() );
for Pb2+ the rate increases from 0.0046 to 0.0057 meq/g·min, and for
Fe3+ this rate increases from 0.0024 to 0.0029 meq/g·min; comparing dosage
40 g/L to 80 g/L, respectively. This finding in correlation with the lower
overall expected uptake at equilibrium demonstrates that the Dosage 80 (8 g/100
mL) has reached its threshold of available active sorption sites. A higher removal at a faster rate comes at a cost of consuming
more zeolite material; with the Dosage 40 (4 g/100 mL) considered more economically feasible.
);
for Pb2+ the rate increases from 0.0046 to 0.0057 meq/g·min, and for
Fe3+ this rate increases from 0.0024 to 0.0029 meq/g·min; comparing dosage
40 g/L to 80 g/L, respectively. This finding in correlation with the lower
overall expected uptake at equilibrium demonstrates that the Dosage 80 (8 g/100
mL) has reached its threshold of available active sorption sites. A higher removal at a faster rate comes at a cost of consuming
more zeolite material; with the Dosage 40 (4 g/100 mL) considered more economically feasible.
In accordance with the
fundamental principles of sorption (adsorption and ion-exchange), when intra-particle
diffusion (IPD) as considered as the rate-limiting step, the sorption rate is
proportional to ![]() ;
where
;
where![]() is
the diffusion coefficient of a specific HMI. Since the dp should not affect either the equilibrium state
or the
is
the diffusion coefficient of a specific HMI. Since the dp should not affect either the equilibrium state
or the ![]() ,
higher sorption rates should be observed for smaller particle sizes. However, smaller particle sizes may exhibit
lower rates, due to lower effective
,
higher sorption rates should be observed for smaller particle sizes. However, smaller particle sizes may exhibit
lower rates, due to lower effective ![]() values, caused by structural problems or
pore clogging [21]. It is important to note that the natural (as-received)
zeolite mineral sample is put through a systematic cleaning cycle, thoroughly
washing before use. Therefore, pore clogging is not expected to affect the
diffusion coefficients which are considered to be constant regardless of particle
size. Then, with intra-particle diffusion considered as the controlling step,
the exchange rate should be increased by decreasing particle size [21]; as demonstrated.
values, caused by structural problems or
pore clogging [21]. It is important to note that the natural (as-received)
zeolite mineral sample is put through a systematic cleaning cycle, thoroughly
washing before use. Therefore, pore clogging is not expected to affect the
diffusion coefficients which are considered to be constant regardless of particle
size. Then, with intra-particle diffusion considered as the controlling step,
the exchange rate should be increased by decreasing particle size [21]; as demonstrated.
Based on the trends observed, the ideal levels of these two operation parameters (particle size dp,D and 4g/L dosage) are selected moving forward in this study.
3. 2. Influent Concentration
In addition to maintaining a total 10 meq/L initial concentration, this component of the study is also conducted at 400 mg/L for each HMI, based on the median range of conversion from meq/L to mg/L concentrations for a majority of the HMI investigated throughout this research endeavour; for single-lead [Pb], triple- [T], and multi- [M] component system combinations (Table 5).
The difference in the removal of each HMI investigated when the influent concentration is set to meq/L versus mg/L is evident. The trends detected are consistent with the literature; the amount in mg of Pb2+ ions available for uptake by zeolite decreases, theoretically from 1036 mg/L to 400 mg/L and the amount of the other four ions (in mg) has increased with this conversion of influent concentration. Oter and Akcay [35] demonstrated consistent findings, as the initial concentration increases, the amount of sorbed HMI increases, while the percent of sorbed HMI decreases for all ions.
Table 5. The HMI Removal Variation by Influent Concentration.
| System | HMI | Total 10 meq/L | 400 mg/L per HMI | |||
| %R | %R | |||||
| mg/g | meq/g | mg/g | ||||
| [Pb] | Pb2+ | 23.31 | 0.192 | 77 | 9.36 | 95 |
| [T] | Pb2+ | 9.01 | 0.075 | 90 | 7.35 | 80 |
| Cu2+ | 0.64 | 0.016 | 19 | 1.04 | 11 | |
| Fe3+ | 0.85 | 0.041 | 50 | 1.73 | 18 | |
| TOTAL | – | 0.132 | – | – | – | |
| [M] | Pb2+ | 5.52 | 0.047 | 94 | 7.62 | 80 |
| Cu2+ | 0.41 | 0.011 | 22 | 0.75 | 8.4 | |
| Fe3+ | 0.58 | 0.028 | 56 | 1.51 | 16 | |
| Ni2+ | 0.15 | 0.005 | 9.1 | 0.18 | 1.8 | |
| Zn2+ | 0.30 | 0.008 | 16 | 0.41 | 4.6 | |
| TOTAL | – | 0.099 | – | – | – | |
Inglezakis et al. [16] demonstrates that dilution leads to an increase in the volume of treated solution to breakthrough (5-10% of the influent concentration) in continuous column configuration; the magnitude of which depends on the specific metal exchanged. This finding can be attributed to the increase of selectivity in the ion-exchange mechanism of sorption by dilution. The valences of the exchanging cations have a strong effect on ion-exchange at equilibrium, and consequently on the removal efficiency. This attribute is referred to as the “concentration-valency effect”. It is theoretically recognized that when the exchanging ions are not of equal valence, the equilibrium is a function of the total concentration; at higher concentrations, this process prefers the uptake of the lower charged cations and subsequently excludes higher charged cations from the sorbent [16]. The cations present in the sorbent have valences that differ from those in solution. Consequently, as the dilution increases, the selectivity of the sorbent for the ion with a higher valence also increases. Accordingly, comparative analysis of various metal ions should be conducted at the same normality and temperature, in order to minimize the changes observed in isotherm configuration with dilution [16].
3. 3. Contact Time and Set-Temperature
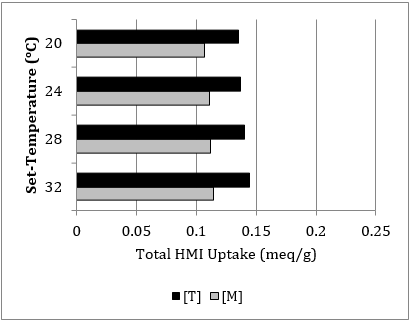
With [Pb], [T], and [M] component system combinations at total 10 meq/L influent concentration: (1) the contact time is extrapolated from 3 hrs to 4.5 and 6 hrs (Table 6), and (2) the set-temperature is evaluated to an adjusted range of 20 to 32oC at 180 contact min (Table 7).
Table 6. The HMI Removal Variation by Contact Time at 22oC Set-Temperature.
| Contact Time (mins) | |||||||
| System | HMI | 180 | 270 | 360 | |||
| %R | %R | %R | |||||
| [Pb] | Pb2+ | 0.211 | 84 | 0.223 | 90 | 0.230 | 92 |
| [Pb-Cu] | Pb2+ | 0.116 | 93 | 0.119 | 95 | 0.120 | 97 |
| Cu2+ | 0.025 | 20 | 0.031 | 25 | 0.034 | 27 | |
| TOTAL | 0.141 | - | 0.150 | - | 0.155 | - | |
| [Pb-Fe] | Pb2+ | 0.109 | 87 | 0.114 | 92 | 0.118 | 94 |
| Fe3+ | 0.054 | 43 | 0.060 | 48 | 0.064 | 52 | |
| TOTAL | 0.163 | - | 0.174 | - | 0.182 | - | |
| [T] | Pb2+ | 0.076 | 92 | 0.079 | 95 | 0.080 | 96 |
| Cu2+ | 0.018 | 21 | 0.022 | 27 | 0.025 | 30 | |
| Fe3+ | 0.041 | 49 | 0.046 | 55 | 0.049 | 59 | |
| TOTAL | 0.135 | - | 0.147 | - | 0.153 | - | |
| [M] | Pb2+ | 0.047 | 95 | 0.048 | 97 | 0.049 | 97 |
| Cu2+ | 0.013 | 26 | 0.015 | 30 | 0.016 | 33 | |
| Fe3+ | 0.029 | 59 | 0.031 | 63 | 0.033 | 67 | |
| Ni2+ | 0.005 | 9.6 | 0.005 | 9.8 | 0.005 | 10 | |
| Zn2+ | 0.011 | 22 | 0.013 | 25 | 0.014 | 28 | |
| TOTAL | 0.106 | - | 0.112 | - | 0.117 | - | |
Table 7. The HMI Removal Variation by Set-Temperature at 180 Contact Min.
| Set-Temperature (oC) | |||||||||
| HMI | 20 | 24 | 28 | 32 | |||||
| %R | %R | %R | %R | ||||||
| [T] | Pb2+ | 0.075 | 91 | 0.076 | 92 | 0.076 | 92 | 0.077 | 93 |
| Cu2+ | 0.018 | 22 | 0.019 | 23 | 0.020 | 24 | 0.022 | 27 | |
| Fe3+ | 0.041 | 50 | 0.041 | 49 | 0.043 | 52 | 0.045 | 54 | |
| TOTAL | 0.135 | – | 0.137 | – | 0.140 | – | 0.144 | – | |
| [M] | Pb2+ | 0.047 | 95 | 0.048 | 95 | 0.048 | 95 | 0.048 | 96 |
| Cu2+ | 0.013 | 25 | 0.014 | 28 | 0.014 | 28 | 0.015 | 30 | |
| Fe3+ | 0.030 | 60 | 0.030 | 60 | 0.031 | 62 | 0.031 | 63 | |
| Ni2+ | 0.006 | 13 | 0.007 | 13 | 0.007 | 13 | 0.007 | 13 | |
| Zn2+ | 0.011 | 22 | 0.012 | 25 | 0.013 | 25 | 0.014 | 27 | |
| TOTAL | 0.107 | – | 0.111 | – | 0.112 | – | 0.114 | – | |
When the uptake data (in meq/g) of Table 5 is compared to the contact time observations in Table 6 at 180 contact min, the removal efficiency is similarly on trend. Only a 5.94% average percent difference in the uptake of total HMIs of [Pb], [T], and [M] is detected. When this same comparison is made with 20oC uptake of [T] and [M] data of Table 7 (a temperature below the controlled 22oC), only a 4.85% average percent difference in the uptake of total HMIs is detected. These observations demonstrate continuity and repeatability of the experimental procedure.
To visualize the influence of both operating parameters, Figure 3 and Figure 4 display the total HMI uptake (meq/g) with respect to extrapolated contact time and set-temperature, respectively.
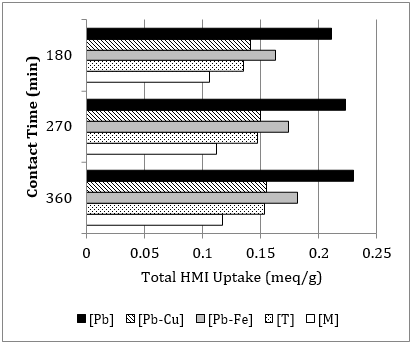
A greater increase in uptake of the total HMIs occurs from 180 to 270 min by, on
average 0.010 meq/g compared to 0.006 meq/g from 270 to 360 min. This
demonstrates the expected proportionality between uptake and contact time. For Pb2+, the theoretical ![]() of 0.2440 meq/g by the PSO model (Table 4) is experimentally supported by
the
of 0.2440 meq/g by the PSO model (Table 4) is experimentally supported by
the ![]() of 0.230 meq/g. Research
conducted by Oter and Akcay [35] demonstrates that equilibrium is attained for
Cu2+ and Zn2+ in approximately 6 contact hr, while more
rapidly for Pb2+ and Ni2+ at only 1 contact hr. As such, the uptake threshold quickly approaches
equilibrium at 360 min of contact.
of 0.230 meq/g. Research
conducted by Oter and Akcay [35] demonstrates that equilibrium is attained for
Cu2+ and Zn2+ in approximately 6 contact hr, while more
rapidly for Pb2+ and Ni2+ at only 1 contact hr. As such, the uptake threshold quickly approaches
equilibrium at 360 min of contact.
The results in Table 7 are on trend, with the direct proportionality between the systematic increase in set-temperature and uptake. This supports the fact that the sorbent’s structure and surface functional groups are influenced by temperature between 20-35oC, observed by the overall sorption capacity [4]. However, the impact of set-temperature is not as significant within this selected range of study conditions.
3. 4. Heat Pre-Treatment
The hydrothermal stability of zeolites establishes the operational lifetime of a material, as well as degradation and regeneration conditions [39]. It is a measure of the structural changes that occur when exposed to water vapour at high temperatures and pressures [40]. This characteristic depends primarily on the type of zeolite, the silica/aluminum ratio, as well as the divalent/monovalent ratio and nature of cations entering the framework [39, 41]. The dehydration process is related to the considerable energy required to break bonds holding water molecules in the intra-crystalline channels of zeolite, as well as to overcome the energy barrier with diffusion of water molecules in the channels of the framework. The structural changes that occur are influenced by the degree of participation of water molecules in the energy balance of zeolite. Therefore, water molecules positioned in cavities and channels of the zeolite framework contribute to the compensation of the non-uniformly distributed charge of the silicate framework and cations. When water is separated from the crystalline lattice, the charge distribution breaks down. This leads to a deformation of the framework and variation in the mobile cations’ positions [39].
Motsi et al. [1] investigates the uptake efficiency of natural zeolite for the heavy metallic ions (HMIs) Fe3+, Cu2+, Mn2+ and Zn2+. The effects of heat pre-treatment are examined with the exposure to a muffle furnace at 200oC, 400oC, and 800oC for 30 mins. The pre-treated zeolite is then in contact with the HMIs in single-component solutions for 6 hrs. It is observed that the specific surface area is improved when treated at 200oC. An increase in both the adsorption rate and capacity due to this thermal treatment is caused by the removal of water from internal channels, which leave them vacant [1]. However, this trend is minimized beyond this temperature threshold. The structure collapses and the porosity inevitably decreases. The rate of adsorption by calcined zeolite is faster compared to untreated zeolite, but the efficiency decreases for zeolite exposed to very high temperatures.
The dehydration of zeolite occurs at a temperature that significantly exceeds the boiling point of water. A considerable amount of water is removed continuously and reversibly, both partially and completely [39, 41], when exposed to heat from air at room temperature. When exposed to heat at approximately 350-400oC [12,41,43], the water is eliminated, and the cations fall back into positions on the inner surface of channels and central cavities of the zeolite structure. Dehydration of zeolite is an endothermic process, thereby causing ‘activation’ of the material [12] between 250-400oC [40] at approximately 350oC [41]; with a structural stability of up to 750oC [41,44]. Research has also revealed that the relationship between the dehydration mechanism of zeolite and positions occupied by aluminum and cations in its structure have an effect on the thermal stability. Thermal treatment of zeolite between 500-600oC causes the loss of one H2O for every two tetrahedral aluminum atoms. This temperature range instigates a loss of oxygen atoms in framework, producing structural vacancies [42]. Beyond this thermal threshold, the crystalline structure breaks down and the clinoptilolite becomes an amorphous solid [40,41].
Langelia et al. [42] investigates three thermal behavioural types of zeolites. This work emphasizes that reversible dehydration with minimal framework contraction would be observed upon heating up to approximately 230oC (Type-1) and 280oC (Type-2), while irreversible structural changes hinders rehydration at a range of 230-260oC (Type-1) and 280-400oC (Type-2). Also, heat pre-treatment greater than 450oC (Type-1) and 550oC (Type-2) causes a thermally induced collapse of the zeolite structure. Behavioural Type-3 exhibits continuous reversible dehydration with only very small structural contraction; the framework is not destroyed at an exposure of up to 750oC. High aluminum and alkaline-earth contents give rise to Type-1. An increase in silicon and/or alkaline-earth cations leads to a progressive change in thermal behavior in the order of Type-1 to -2 to -3. The study presented in this paper is also comparable with the findings of Langelia et al. [42], as the temperature levels analyzed exhibit Type-2 behaviour [45].
3. 4. 1. Heavy Metallic Ion Pre-Treatment Trends
Table 8
provides the HMI uptake at 180 min
(![]() in
meq/g) of contact for non-heated
and heat-pre-treated zeolite in the triple-[T] and multi-[M] component systems.
With each heat pre-treatment level, the same trend is maintained among the
various component systems. Once again, for all operation parameters
investigated in this study, the zeolite exhibits the highest affinity and
favoured uptake for that of the Pb2+ ion [4,14,16,21,22,46] followed
by Fe2+ and Cu2+, with a lower affinity to Zn2+
then Ni2+. A significant loss in crystallinity and hence catalytic
activity are common with this pre-treatment process [47]. Dehydration
temperature as well as micropore volume and transitional porosity development
are directly proportional [40]. It is important to increase surface area, porosity and
sorption capacities of natural zeolites without crystallinity loss [47]. The percent removal
of the Pb2+ ion in [M] is 93.97%, while only 56.70% in [M-600]. The percent
removal of the total HMIs reduces from 16.47% to 3.68% going from
non-heat-pre-treated to 600oC exposure. This demonstrates the extreme temperature effects on the zeolite’s sorption capacity to the HMIs of interest.
in
meq/g) of contact for non-heated
and heat-pre-treated zeolite in the triple-[T] and multi-[M] component systems.
With each heat pre-treatment level, the same trend is maintained among the
various component systems. Once again, for all operation parameters
investigated in this study, the zeolite exhibits the highest affinity and
favoured uptake for that of the Pb2+ ion [4,14,16,21,22,46] followed
by Fe2+ and Cu2+, with a lower affinity to Zn2+
then Ni2+. A significant loss in crystallinity and hence catalytic
activity are common with this pre-treatment process [47]. Dehydration
temperature as well as micropore volume and transitional porosity development
are directly proportional [40]. It is important to increase surface area, porosity and
sorption capacities of natural zeolites without crystallinity loss [47]. The percent removal
of the Pb2+ ion in [M] is 93.97%, while only 56.70% in [M-600]. The percent
removal of the total HMIs reduces from 16.47% to 3.68% going from
non-heat-pre-treated to 600oC exposure. This demonstrates the extreme temperature effects on the zeolite’s sorption capacity to the HMIs of interest.
Table 8. HMI Uptake by Heat Pre-Treatment Level.
| Heat Level | Non-Heated | 200oC | 400oC | 600oC | ||||
| System | [T] | [M] | [T] | [M] | [T] | [M] | [T] | [M] |
| HMI | ||||||||
| Pb2+ | 0.075 | 0.047 | 0.073 | 0.047 | 0.057 | 0.040 | 0.038 | 0.028 |
| Cu2+ | 0.016 | 0.011 | 0.015 | 0.011 | 0.008 | 0.006 | 0.006 | 0.003 |
| Fe3+ | 0.041 | 0.028 | 0.036 | 0.025 | 0.024 | 0.017 | 0.026 | 0.017 |
| Ni2+ | – | 0.005 | – | 0.004 | – | 0.004 | – | 0.003 |
| Zn2+ | – | 0.008 | – | 0.008 | – | 0.004 | – | 0.002 |
| TOTAL HMI | 0.132 | 0.099 | 0.124 | 0.094 | 0.088 | 0.071 | 0.070 | 0.052 |
Figure 5 displays the effects of each heat pre-treatment level, with respect to the percentage of non-heated zeolite uptake. Evidently, the presence of each HMI in solution impacts the uptake of the other; as seen by the interference of the Ni2+ and Zn2+ ions in the [M] component system uptake of the Cu2+, Fe3+, and Pb2+ ions associated with the [T] system. Comparing [T] to [M], the uptake of the Pb2+ ion is reduced by 36.2%, 30.4% and 25.9% at the heat pre-treatment levels of 200oC, 400oC, and 600oC, respectively, and 37.5% without heat pre-treatment. When heat-pre-treated to 600oC, the total HMI uptake is reduced by approximately 47% in both systems.
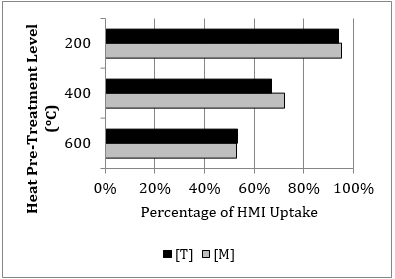
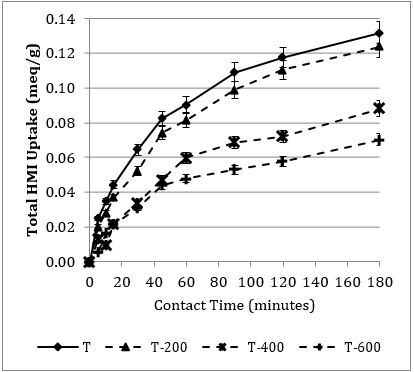
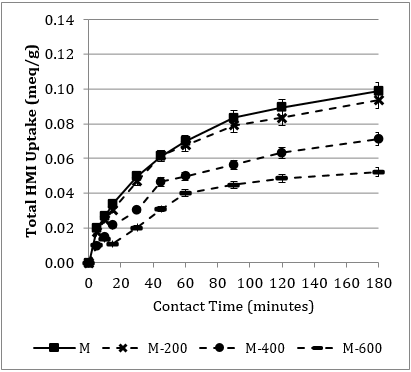
Figure 6 displays the total HMI uptake over the 3-hr contact period for each heat pre-treatment level, for the [T] (6a.) and [M] (6b.) component systems, respectively. This study is consistent with the three distinct stages discussed by Sprynskyy et al. [4]. As expected, there is a slightly greater uptake in the [T] over time; attributed to the interference of the additional two HMIs in the [M]. The rate of uptake for both component systems is not significantly affected by the 200oC heat exposure. The first 45-min period is very similar for [M-200], compared to the non-heated. Consistent with the findings of Motsi et al. [1], a substantial reduction of HMI uptake occurs at the 400oC threshold.
3. 4. 2. Qualitative Pre-Treatment Trends
Qualitative analysis of the natural zeolite is conducted to observe the surface topography over time, by a high-resolution Scanning Electron Microscopy (SEM) technology (6380LV, JEOL, USA), equipped with Oxford energy dispersive X-ray spectroscopy (EDS) and electron backscatter diffraction (EBSD) capacity.
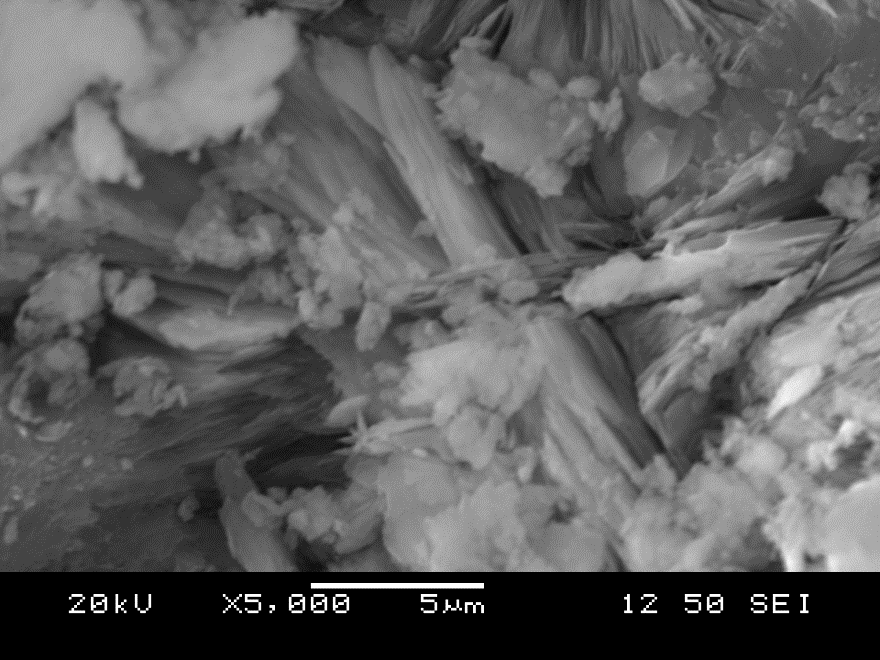
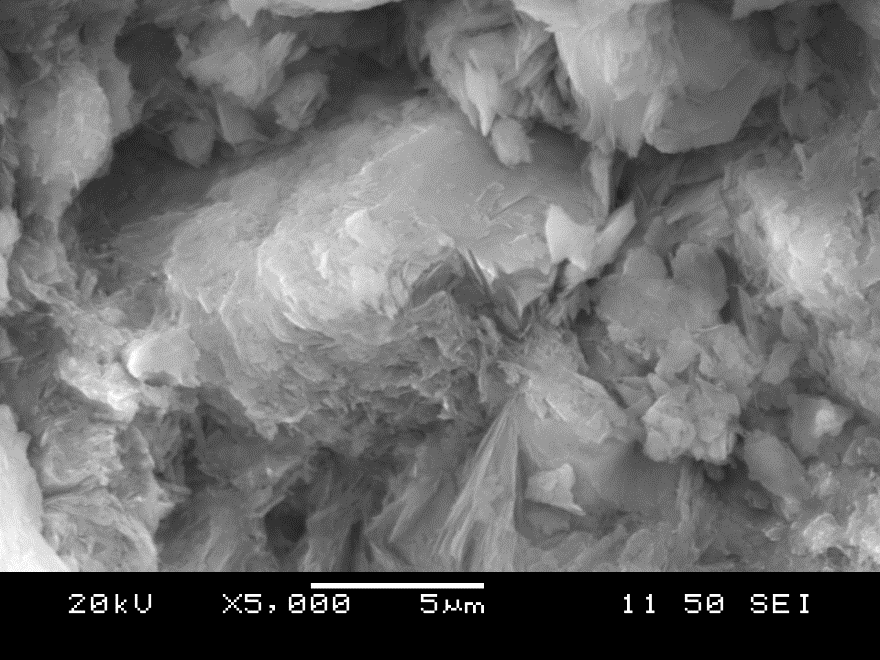
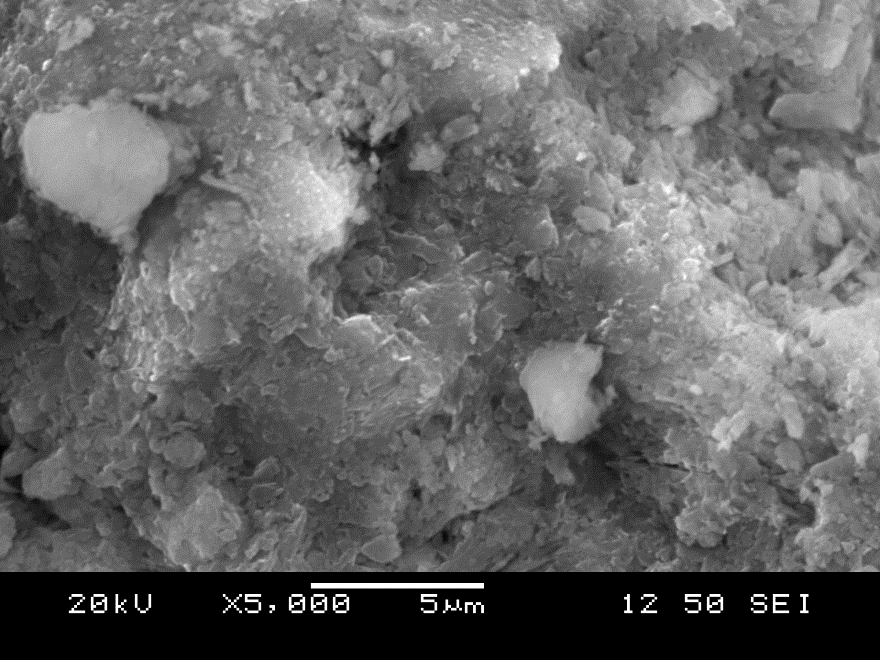
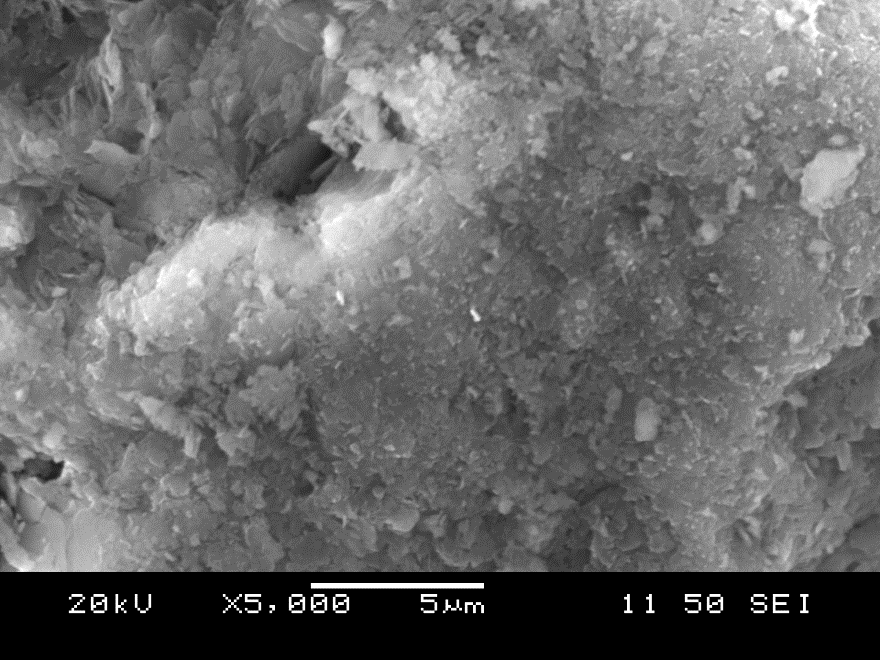
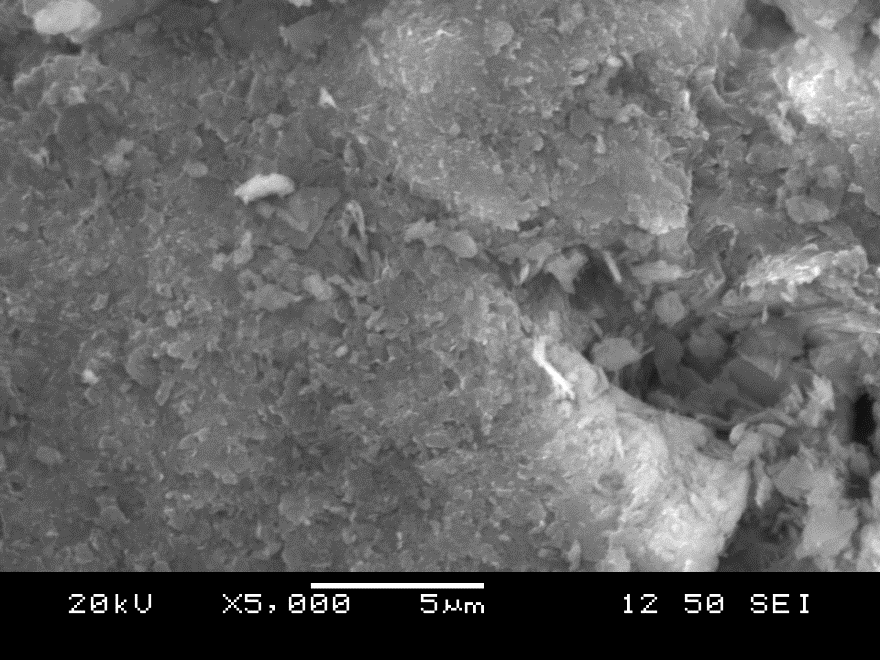
Once the cleaning cycle of the raw zeolite sample is complete, the as-received pale green colour is sustained. Following the progressive heat pre-treatment exposure, this colour transitions to a pink, pale pink, then light brown colour [45]. Figure 7 provides SEM images obtained by the high-resolution microscope, taken at ×5000 magnification (5 µm scale bar). Subtle physical changes of the surface structure are observed when comparing the raw granules (shown in 7a.) to those exhibited to the cleaning cycle (shown in 7b.). The images of the zeolite exposed to heat pre-treatment of 200oC, 400oC, and 600oC are shown in 7c., 7d., and 7e., respectively. To point out once again, a substantial reduction of HMI uptake occurs within the 400-600oC temperature range of this study [1]. The non-heated uptake in [T] and [M] is achieved by 93.9% and 95.0% in [T-200] and [M-200], respectively. This is qualitatively observed in Figure 7b. and 7c., with the visual similarity.
As seen in Table 8, the sorption capacity is significantly compromised at the 400oC and 600oC exposures; which is supported by the lack of textural complexity in Figure 7d. and 7e., respectively. It is visually evident that the raw sample possesses textured granularity and significant detail, which is subsequently diminished with heat-pre-treatment towards the inter-granular spaces and mineral crevasses. This provides additional knowledge into how the structure of the zeolite mineral has been modified [45]. However, the process of dehydration requires a considerable amount of energy, which practically outweighs the interest to ‘activate’ the structure of the mineral sample. Both the quantitative and qualitative observations demonstrate that there is no economic benefit to the hydrothermal pre-treatment of the zeolite mineral, under the testing conditions.
Innovative treatment technologies are a challenge for all related industry, which include but are not limited to high associated economic costs and pollutant specific methods. Consequently, the conversion of inorganic ion exchangers into hybrid fibrous or nanoscale ion exchangers is considered to be the latest development of the water treatment industry. These materials are gaining attention, as they demonstrate a high efficiency and rate of sorption with short diffusion path towards environmental pollutants. Among metal-containing nanoparticles, carbonaceous materials and dendrimers, zeolites are considered as one of the most progressive functional and nano-sized materials of the millennium. The prospects of this mineral are promising, and its unique position is attributed to its sorption properties particularly through their surface treatment. Nanoscale science and engineering developments are providing extraordinary opportunities to develop more cost effective and environmentally acceptable water purification processes [48].
3. 5. Acidity Observations
It is important to note that the pH level of every ICP-AES sample (stock solution and sorbent-solution contact) is measured for all operating parameters investigated; utilizing the accumet Basic AB15 pH Meter (Fisher Scientific; CAT No. 13 636 AB15). This is conducted after batch mode contact, and before dilution (following 24 hr storage) in preparation for calibration. The set-up of the initial stock pH level is kept consistent throughout all experiments; an average of 1.85 is detected. The average maximum and minimum values between the batch bottle and stored supernatant samples are summarized in Table 9.
Table 9. The Average pH Level Data.
| pH Sample | ||
| Observation | Batch Contact | Storage Filter |
| Maximum | 2.18 | 2.14 |
| Minimum | 1.90 | 1.89 |
This data is based on a Dosage 40 ratio (4 g/100 mL); excluding the pH observations for the Dosage 80 (8 g/100 mL) parameter. At 45 min of contact for all HMIs at Dosage 80 conditions, the effluent becomes more basic to reach a pH level of just above 2.20. Overall, the samples collected show an average pH level maximum and minimum of 2.39 and 1.91, respectively. This level is still quite acidic, and is well within the typical 2 to 5 range as investigated in the Canada-Wide AMD Survey [17]. This brings attention to the fact that the H+ ions are in competition with the HMI of interest [15,16]. The doubled dosage provides greater active sites availability for sorption to occur. The decision to proceed with particle size D (dp,D) as the controlled parameter in the analysis is justified, given that the pH level was kept consistent to the completion of this study.
4. Conclusions
The removal efficiency of heavy metallic ions by natural zeolite increases by:
- Decreasing particle size and influent concentration;
- Increasing dosage level, contact time and set-temperature, and by;
- Maintaining the heat-pre-treatment within limits of the activation threshold.
The efficiency is improved depending on the specific metal and the parameter observed. Since the heavy metals selected in this present study possess different chemical and physical properties influenced in the same manner, it can be qualitatively speculated that other heavy metals would be equally influenced [46]. The removal efficiency order (or selectivity series) is consistent for all examined experimental conditions: Pb2+>>Fe3+>Cu2+>Zn2+>Ni2+ [22,45].
The sorption uptake of HMIs by natural zeolite is complex, due to the aqueous chemistry of the elements and the nature of the sorbent mineral [35]. However, this research provides a greater insight into how the presence of multiple metallic ions and various operative parameters impact the overall removal efficiency, and indicates how the sorption properties of zeolite influence the overall selectivity trends. This is a significant contribution to the current knowledge-base, and how these parameters impact the natural mineral batch mode, for the scale-up to continuous column design and configuration for industrial treatment applications.
References
[1] T. Motsi, N. A. Rowson, M. J. H. Simmons, “Adsorption of heavy metals from acid mine drainage by natural zeolite,” International Journal of Mineral Processing, vol. 92, no. 1-2, pp. 42-48, 2009. View Article
[2] A. Akcil, S. Koldas, “Acid Mine Drainage (AMD): Causes, treatment and case studies,” Journal of Cleaner Production, vol. 14, pp. 1139-1145, 2006. View Article
[3] E. Erdem, N. Karapinar, R. Donat, “The removal of heavy metal cations by natural zeolites,” Journal of Colloid and Interface Science, vol. 280. pp. 309-314, 2004. View Article
[4] M. Sprynskyy, B. Buszewski, A. P. Terzyk, J. Namiesnik, “Study of the selection mechanism of heavy metal (Pb2+, Cu2+, Ni2+, and Cd2+) adsorption on clinoptilolite,” Journal of Colloid Interface Science, vol. 304, pp. 21-28, 2006. View Article
[5] M. A. Acheampong, R. J. W. Meulepas, P. N. L. Lens, “Removal of heavy metals and cyanide from gold mine wastewater,” Journal of Chemical Technology and Biotechnology, vol. 85, pp. 590-613, 2010. View Article
[6] C. Wang, J. Li, X. Sun, L. Wang, X. Sun, “Evaluation of zeolites synthesized from fly ash as potential adsorbents for wastewater containing heavy metals,” Journal of Environmental Sciences, vol. 21, pp. 127-136, 2009. View Article
[7] T. Motsi, N. A. Rowson, M. J. H. Simmons, “Kinetic studies of the removal of heavy metals from acid mine drainage by natural zeolite,” International Journal of Mineral Processing, vol. 101, pp. 42-49, 2011. View Article
[8] L. Curkovic, S. Cerjan-Stefanovic, T. Filipan, “Metal ion exchange by natural and modified zeolites,” Water Research, vol. 31, no. 6, pp. 1379-1382, 1997. View Article
[9] F. Helfferich, Ion Exchange. Series in Advanced Chemistry. McGraw-Hill, New York, USA, 1962, pp. 95-322.
[10] V. J. Inglezakis, S. G. Poulopoulos, “Adsorption and Ion-Exchange (Kinetics),” In Adsorption, Ion Exchange and Catalysis, Design of Operations and Environmental Applications, 1st ed., Elsevier Science: Amsterdam, The Netherlands, 2006, pp. 262-266. ISBN-13: 978-0-444-52783-7. View Book
[11] G. V. Tsitsishvili, “Perspectives of Natural Zeolite Applications,” Occurrences, Properties and Utilization of Natural Zeolites, Akademiai Kiado: Budapest, Hungary, 1988, pp. 367-393.
[12] F. A. Mumpton, J. R. Boles, E. M. Flanigen, A. J. Gude, R. A. Sheppard, R. L. Hay, R. C. Surdam, Mineralogy and Geology of Natural Zeolites. Washington, D.C.: Mineralogical Society of America, 1977, pp. 165. ISBN: 0939950049.
[13] S. Wang, Y. Peng, “Natural zeolites as effective adsorbents in water and wastewater treatment,” Chemical Engineering Journal, vol. 156, pp. 11-24, 2010. View Article
[14] V. J. Inglezakis, M. D. Loizidou, H. P. Grigoropoulou, “Equilibrium and kinetic ion exchange studies of Pb2+, Cr3+, Fe3+ and Cu2+ on natural clinoptilolite,” Water Research, vol. 36, pp. 2784-2792, 2002. View Article
[15] B. Ersoy, M. S. Celik, “Electrokinetic properties of clinoptilolite with mono- and multivalent electrolytes,” Microporous and Mesoporous Materials, vol. 55, pp. 305-312, 2002. View Article
[16] V. J. Inglezakis, M. D. Loizidou, H. P. Grigoropoulou, “Ion exchange of Pb2+, Cu2+, Fe3+, and Cr3+ on natural clinoptilolite: selectivity determination and influence of acidity on metal uptake,” Journal of Colloid Interface Science, vol. 261, pp. 49-54, 2003. View Article
[17] L. J. Wilson. (2014, October 30). “Canada-Wide Survey of Acid Mine Drainage Characteristics. Project Report 3.22.1-Job No. 50788,” Mineral Sciences Laboratories Division Report MSL 94–32 (CR), Ontario Ministry of Northern Development and Mines. Mine Environment Neutral Drainage (MEND) Program, Canada, 1994. [Online]. Available: http://mend-nedem.org/wp-content/uploads/2013/01/3.22.1.pdf
[18] H. Cui, L. Y. Li, J. R. Grace, “Exploration of remediation of acid rock drainage with clinoptilolite as sorbent in a slurry bubble column for both heavy metal capture and regeneration,” Water Research, pp. 3359-3366, 2006. View Article
[19] T. Motsi, “Remediation of Acid Mine Drainage using Natural Zeolite,” Ph.D. Thesis, School of Chemical Engineering, The University of Birmingham, United Kingdom, 2010. View Thesis
[20] W. Xu, L. Y. Li, J. R. Grace, G. Hebrard, “Acid rock drainage treatment by clinoptilolite with slurry bubble column: Sustainable zinc removal with regeneration of clinoptilolite,” Applied Clay Science, vol. 80-81, pp. 31-37, 2013. View Article
[21] V. J. Inglezakis, H. Grigoropoulou, “Effects of operating conditions on the removal of heavy metals by zeolite in fixed bed reactors,” Journal of Hazardous Materials, vol. 112, pp. 37-43, 2004. View Article
[22] A. L. Ciosek, G. K. Luk, “Lead Removal from Mine Tailings with Multiple Metallic Ions,” International Journal of Water and Wastewater Treatment, vol. 3, pp. 1-9, 2017. View Article
[23] A. L. Ciosek, G. K. Luk, “Kinetic Modelling of the Removal of Multiple Heavy Metallic Ions in Mine Waste by Natural Zeolite Sorption,” Special Issue: Treatment of Wastewater and Drinking Water through Advanced Technologies, In Water, vol. 9, no. 7, pp. 482, 2017. View Article
[24] A. L. Ciosek, G. K. Luk, “An Innovative Dual-Column System for Heavy Metallic Ion Sorption by Natural Zeolite,” Special Issue: Wastewater Treatment and Reuse Technologies, In Applied Sciences, vol. 7, no. 8, pp. 795, 2017. View Article
[25] Canadian Minister of Justice (CMJ). Metal Mining Effluent Regulations. Consolidation SOR/2002-222. 2014. [Online]. Available: http://laws-lois.justice.gc.ca
[26] H. V. Bekkum, E. M. Flanigen, J. C. Jansen, “Ion-Exchange in Zeolites” In Introduction to Zeolite Science and Practice—Studies in Surface Science and Catalysis, 1st ed., Elsevier Science: Zeist, The Netherlands, vol. 58, 1991, pp. 359-390. View Book
[27] E. W. Rice, R. B. Baird, A. D. Eaton, L. S. Clesceri, “Part 1000-Introduction, Part 3000-METALS,” In Standard Methods for the Examination of Water and Wastewater, 22nd ed., APHA, AWWA, WEF: Washington DC, USA, 2012, pp. 1.1-68; 3.1-112, ISSN: 978-087553-013-0.
[28] M. Minceva, R. Fajgar, L. Markovska, V. Meshko, “Comparative Study of Zn2+, Cd2+, and Pb2+ Removal From Water Solution Using Natural Clinoptilolitic Zeolite and Commercial Granulated Activated Carbon: Equilibrium of Adsorption,” Separation Science and Technology, vol. 43, pp. 2117-2143, 2008. View Article
[29] U. Wingenfelder, C. Hansen, G. Furrer, R. Schulin, “Removal of Heavy Metals from Mine Waters from Natural Zeolites,” Environmental Science and Technology, vol. 39, no 12, pp. 4606-4613, 2005. View Article
[30] Bear River Zeolite Co. Inc. (2012 and 2017, September 1). Zeolite-Specifications and MSDS. [Online]. Available: http://www.bearriverzeolite.com
[31] V. J. Inglezakis, C. D. Papadeas, M. D. Loizidou, H. P. Grigoropoulou, “Effects of Pretreatment on Physical and Ion Exchange Properties of Natural Clinoptilolite,” Environmental Technology, vol. 22, pp. 75-82, 2001. View Article
[32] Perkin Elmer Inc., Atomic Spectroscopy—A Guide to Selecting the Appropriate Technique and System: World Leader in AA, ICP-OES, and ICP-MS, Perkin Elmer Inc., Waltham MA, USA, 2011. View Report
[33] Perkin Elmer Inc., WinLab32 for ICP—Instrument Control Software, version 5.0, Perkin Elmer Inc., Waltham MA, USA, 2010.
[34] J. Mullin, “Physical and thermal properties,” In Crystallization, 4th ed., Read Educational and Professional Publishing Ltd., Woburn, MA, USA, pp. 76-77, 2001. IBSN: 0-7506-4833-3.
[35] O. Oter, H. Akcay, “Use of Natural Clinoptilolite to Improve Water Quality: Sorption and Selectivity Studies of Lead(II), Copper(II), Zinc(II), and Nickel(II),” Water Environment Research, vol. 79, no. 3. pp. 329-335, 2007. View Article
[36] H. Qiu, L. Lv, B. C. Pan, Q. J. Zhang, W. M. Zhang, Q. X. Zhang, “Critical review in adsorption kinetic models,” Journal of Zhejiang University Science A, vol. 10, pp. 716-724, 2009. View Article
[37] N. Bektas, S. Kara, “Removal of lead from aqueous solutions by natural clinoptilolite: Equilibrium and kinetic studies,” Separation and Purification Technology, vol. 39, pp. 189-200, 2004. View Article
[38] Y. Ho, A. E. Ofomaja, “Pseudo-second-order model for lead ion sorption from aqueous solutions onto palm kernel fiber,” Journal of Hazardous Materials, vol. 129, pp. 137-142, 2005. View Article
[39] M. Jovanovic, N. Rajic, B. Obradovic, “Novel kinetic model of the removal of divalent heavy metal ions from aqueous solutions by natural clinoptilolite,” Journal of Hazardous Materials, vol. 233, pp. 57-64, 2012. View Article
[40] M. N. Kostandyan, S. G. Babayan, M. A. Balayan, “Effect of heat treatment on the structural characteristics and sorption properties of clinoptilolite,” Inorganic Materials, vol. 18, no. 10, 0020-1685, pp. 1498 -1501, 1982.
[41] D. W. Breck, Zeolite Molecular Sieves: Structure, Chemistry, and Use. John Wiley & Sons, New York, 1974.
[42] A. Langelia, M. Pansini, G. Cerri, P. Cappellietti, M. De Gennaro, “Thermal Behavior of Natural and Cation-Exchanged Clinoptilolite from Sardinia (Italy),” Clays and Clay Minerals, vol. 51, no. 6, pp. 625-633, 2003. View Article
[43] E. Yörükoğulları, G. Yılmaz, S. Dikmen, “Thermal treatment of zeolitic tuff,” Journal of Thermal Analysis and Calorimetry, vol. 100, no. 3, pp. 925-928, 2010. View Article
[44] K. Margeta, N. Zabukovec Logar, M. Šiljeg; A. Farkaš, “Natural Zeolites in Water Treatment—How Effective Is Their Use,” InTech, Water Treatment W. Elshorbagy, Ed., pp. 81-112, 2013. View Article
[45] A. L. Ciosek, G. K. Luk, “Effects of Heat Pre-Treatment on Metallic Ion Sorption by Natural Zeolite,” Technical Session: Industrial Treatment A, Water Environment Association of Ontario Technical Symposium and OPCEA Exhibition, Ottawa, Canada, 2017. Paper No: 2017-010.
[46] S. K. Ouki, M. Kavannagh, “Performance of natural zeolites for the treatment of mixed metal contaminated effluents,” Waste Management and Research, vol. 15, no. 4, pp. 383-394, 1997. View Article
[47] D. B. Akkoca, M. Yilgin, M. Ural, H. Akcin, A. Mergen, “Hydrothermal and Thermal Treatment of Natural Clinoptilolite Zeolite from Bigadiç, Turkey: An Experimental Study,” Geochemistry International, vol. 51, no. 6, pp. 495-504, 2013. View Article
[48] E. Chmielewská, L. Sabová, K. Jesenák, “Study of adsorption phenomena ongoing onto clinoptilolite with the immobilized interfaces,” Journal of Thermal Analysis and Calorimetry, vol. 92, no. 2, pp. 567-571, 2008. View Article