International Journal of Environmental Pollution and Remediation (IJEPR)
ISSN: 1929-2732

Volume 2 - Year 2014 - Pages 24-29
DOI: 10.11159/ijepr.2014.004
Estimation of Concentration of Dissolved Organic Matter from Sediment by using UV–Visible Spectrophotometer
Shamshad Khan¹, Wu Yaoguo¹, Zhang Xiaoyan¹, Xu Youning², Zhang Jianghua²,Hu Sihai²
¹Department of Applied Chemistry, School of Science,
Northwestern Polytechnical University, Xi'an, 710072, China
shamshadkhan768@yahoo.com; wuygal@nwpu.edu.cn
²Xi'an Institute of Geology and Mineral Resources, Xi'an, 710054, China
Abstract - The objective of this research was to develop a spectrophotometric technique for estimation of concentration of dissolved organic matter (DOM) from sediment. The results showed that the absorbance 272nm is good surrogate to the concentration of the DOM. In addition, absorption of DOM confirmed to be independent of pH values ranging from 3.0 to 11. Compare to the chemical oxygen demand method and TOC–analyzer, the develop correlation technique using the UV–visible absorption is very straightforward, needs much smaller sample volume, and shows a good reproducibility. The absorbance (272nm) increased with increasing the concentrations of DOM with very high correlation coefficient (R2= 0.98). So it is suggested that this technique should be used as a surrogate for estimation of concentration of DOM from sediment.
Keywords: Absorbance, surrogate, sediment, dissolved organic matter, concentration.
© Copyright 2014 Authors - This is an Open Access article published under the Creative Commons Attribution License terms. Unrestricted use, distribution, and reproduction in any medium are permitted, provided the original work is properly cited.
Date Received: 2013-09-15
Date Accepted: 2014-02-20
Date Published: 2014-03-05
1. Introduction
The importance of dissolved organic matter (DOM) as a key parameter in environmental studies is well understood. Dissolved organic matter is involved in mobilization, complexation of trace metals and transport of acidity, colloids, nutrients, metals, and pollutants [1, 2]. Dissolved organic matter act as an originator of carcinogenic disinfection by-products (DBPs) such as trihalomethanes (THMs) and haloacetic acids (HAAs) increased disinfectant demands in the distribution system [3–7] has been extensively studied for the protection of public health. These various interactions with the environment result from the fact that it represents a complex mixture of substances with chemical structure and different size. Therefore, the significance of DOM in the environment is very much associated to its composition.
Even if many studies have been accomplished to reduce the effects of DOM in water treatment, not many literatures are available for the characterization of DOM [8–12]. Therefore, the composition of DOM has been studied by various techniques including spectroscopic measurements, and physical and chemical fractionation, often in combination [1]. Result of these studies is that humic acids are the major part of DOM which includes carbonyl, carboxylic, hydroxyl, methoxyl, and phenolic functional groups. Primary composition for humic acids is carbon (52-56%), hydrogen (4-5.5%), oxygen (33-39%), and small percentages of nitrogen, sulfur, and phosphorus [13]. Based on the degradation products after alkaline hydrolysis and permanganate oxidation, Christman et al. [11] were able to suggest hypothetical structures for humic acids. However, it is for now impossible to observe the complete specific structure of DOM due to its complex structure. At this time, two analytical indirect techniques are commonly available to estimate the concentration of DOM. Total organic carbon (TOC) and UV absorbance measured at 254nm are used as substitute to evaluate the DOM concentration. Total organic carbon (TOC) and UV absorbance (254nm) estimate organic carbon content in the water and are used as a proxy to represent the DOM concentration and in particular, of THMs precursor material [14,15]. It was reported that correlation between UV absorbance at 254nm and disinfection by-products (DBPs) formation potential give a better estimation of organic matter reactivity than TOC [13,16]. But the limitation of this technique is also found in literature [17]. The value of absorbance (254nm) particularly depends on the concentrations of humic acids in water. UV absorbance (254nm) value of humic acids reduces by chlorination due to formation of organic halogen. When the concentration of humic acids is low, the UV254 acquired may be too low and generate a comparatively high random error [3].
Usually, the DOM in water produces an uncharacteristic spectrum by absorbing the ultraviolet light 200nm to 700nm with no sharp peaks [8] and the absorbance decreases as the wavelength increases. There is no visible variation between the spectra for humic and fulvic acids. It has been shown that no maximum or minimum peaks are present on the ultraviolet spectra of the aqueous solution of humic acids [8] and the optical absorbance reduces as the wavelength increases. Although the DOM with different sources may have different configurations and their chemical properties, their spectra are similar. Aromatic moieties parts in DOM offer the possibility to guess the proportion of dissolved organic carbon in DOM using UV–Visible spectrophotometer because UV absorption of organic solutes is directly proportional to their concentration in aromatic compounds [18,19]. This correlation demonstrated that the direct measurement of the UV absorbance gives suitable and valuable information for the characterization of the DOM in water. Wang and Hsieh [3] established a correlation between the absorbance spectrum of different wavelengths (250–350nm) and the concentration in natural organic matter. It is seems probable that a significant relationship could be developed between dissolved organic matter and absorbance at any wavelengths between 200nm and middle of visible range.
Based on the above discussions, the absorbance of DOM solutions at various wavelengths should be able to represent the concentrations of some specific constituents of DOM sample. Thus the objectives of this study are to establish the most favorable wavelength range that provides optimum predictabitly of dissolved organic matter from absorbance and the particular wavelength that should be able to represent the concentration of some particular components of the DOM. In addition we will analysis the effect of pH on the UV–visible spectra of DOM.
2. Material and Methods
A sediment sample was collected from the topsoil (0-15cm) of Weihe riverbed in Xi'an, China. Sediment sample was air-dried, grounded, sieved to ˂ 2 mm and stored in a plastic bottle until used. Selected physiochemical properties of sediment sample are shown in Table 1. Cation exchange capacity (CEC) of sediment was measured at pH 7.0 using 1mol L-1 ammonium acetate. The natural pH of sediment was measured in a 1:10 material/water ratio by pH meter (PHS-3C, Leici, Shanghai, China). Specific surface area (SSA) and micro porosity were evaluated by N2-BET method (TristarⅡ3020, Micromeritics, USA). Elemental composition was measured by energy dispersive spectrometer (INCA X-Act, TESCAN, Cezch). Soil organic carbon (SOC) content was determined by the wet dichromate oxidation method.
Table 1. Basic physicochemical properties of tested sediment.
|
pH |
CEC (cmol.kg-1) |
SSA m2g-1 |
Pore Size (nm) |
SOC |
C |
Ca |
Al |
Fe |
|
|
|
|
|
% |
||||
|
8.0 |
10.54 |
7.23 |
92.32 |
4.79 |
2.80 |
3.98 |
5.64 |
3.57 |
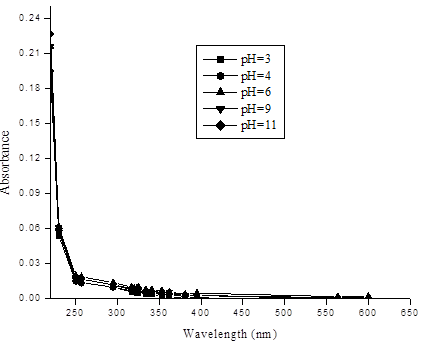
This sediment was used as source of DOM in water. Extraction of DOM was carried out just before absorption experiments by adding 200ml deionized water to 6gram of sediment in a plastic bottle and shaking for 24 h on an orbital shaker at (20±1) °C. After that, the suspension was centrifuged at 900×g for 30 min and filtered through 0.45-μm pore size polycarbonate filter. Total organic carbon was determined by total organic carbon analyzer (TOC–V–VSH, Shimadzu, Tokyo, Japan). The non-purgable organic carbon (NPOC) technique was used to measure TOC (organic carbon remaining in an acidified sample after purging the sample with gas). The result TOC was calculated as a mean of the three valid measurements. Stock solution of 70 mg L-1 of DOM was used to prepare six different concentrations of diluted solutions of DOM. UV–visible absorbance measurements were performed on a high precision, double-beam spectrophotometer (model 2550) between 220 and 600 nm with the reference of distilled water. A quartz cell with 1.0 cm path length was used. Samples were allowed to warm to room temperature before measurement. Duplicates and measurement of the distilled water were made every 10-12 samples to ensure instrument stability. Buffer solution to maintain pH were not required because solutions were prepared at different pH have showed that UV–visible spectra were not notably affected by the 3 to 11 range of pH as shown in Figure 1.
3. Results and Discussion
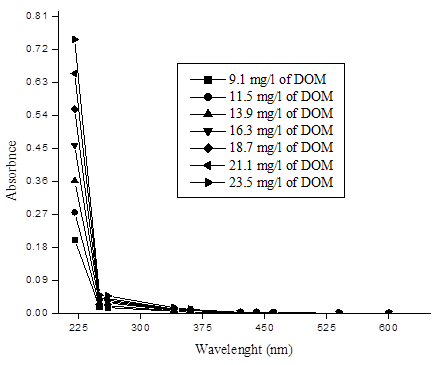
For selection of appropriate wavelength to the concentration of DOM and absorbance in water, various concentrations (9.1, 11.5, 13.9, 16.3, 18.7, 21.1, 23.5mg L-1 ) of DOM. Figure 2 illustrates that the absorbance of DOM increases as the concentrations increase. The absorbance at wavelength length less than 250nm is much larger than of longer wavelength. As a result, a sharp slope is observed at the shorter wavelength (<275nm), this phenomenon is much more visible when the concentration of DOM is high. The absorbance measured at greater wavelength (>360nm) is relatively less than absorbance at 250–360nm. This result is approximately in agreement with the experimental results of Wang and Hsieh [3].
As can be seen in figure 2, absorbance values less than 250nm were not included in the study because of the strong absorbance by nitrates. Wavelength greater than 360nm is also not included due to the insensitivity of absorbance to changes in DOM at longer wavelength. As a consequence the correlation between absorbance and DOM data are restricted to the 250–360nm range.
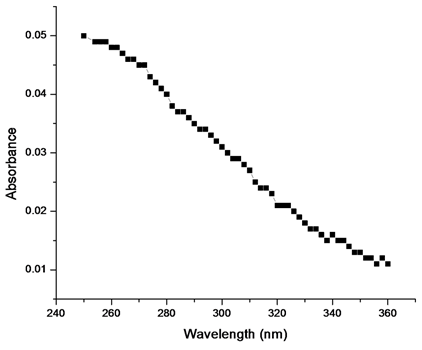
For the estimation of the most favorable wavelength ranges between 250nm and 360nm, it is possible to add all the data to correlation regression analysis by considering the 10nm part length of restricted wavelength range 250–360nm. Correlation coefficient (R2) was determined for each part length of10nm of the restricted wavelength range 250–360nm. The highest correlation coefficient (R2= 0.97) was obtained between range of 270nm and 280nm. Figure 3 shows the correlation of DOM and selected wavelengths range (250–360nm) of 23.5mL solution of DOM. The maximum linear correlation coefficient (R2= 0.97) obtained at wavelength range 270 and 280nm by analysis of all the data of between 250nm and 360nm.The most favorable correlation coefficient (R2=0.97) was obtained between the 270 and 280nm. (The correlation coefficient lower than 270nm and higher 280nm are not shown here due to insignificant values). There is steady decline in the correlation coefficient below 270nm is probably due to growing amount of interferences by organic compounds of dissimilar classes. Drastic decline in correlation coefficient at higher wavelengths (>280nm) that is possibly due to declining the sensitivity of absorbance to the presence of organic compounds. It thus illustrates that DOM is mostly closely associated to absorbance in the wavelength range 270–280nm. The correlation coefficients propose that the ideal analytical wavelength is between 270 and 280nm.
For the selection of most favorable wavelength between the wavelength range 270–280nm, correlation coefficients were examined at interval of 2nm in the wavelength range 270–280nm while increasing the concentrations of DOM solutions. The optimum correlation coefficient (R2=0.98) was obtained at the specific wavelength 272nm between the wavelength range 270–280nm (data not shown). For the verification of this technique, we developed a relationship between the absorbance (272nm) and the different concentrations of DOM determined by TOC carbon analyzer.
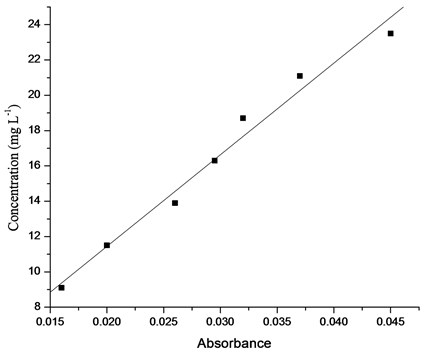
Figure 4 shows the correlation between the absorbance (272nm) and the concentration of DOM of sediment in water. Absorbance at 272nm is highly related (R2> 0.98; P< 0.0001) to the concentration of DOM determined by TOC carbon analyzer. It is recommended that the absorbance at 272nm should be used to estimate the concentration of DOM in sediments.
|
DOM (mg/l)= 518.93×Absorbance (272nm) + 1.065 |
(1) |
In the above equation 1, 518.93 and 1.065 are the slope and y-intercept respectively. The intercept of the regression line illustrate the presence of 1.065mg L-1 of non–UV absorbing DOM, probably due to the organic matter containing no chromophores absorbing at 272nm. This DOM could contain carbohydrates, saturated aliphatic compounds. Data presented in Figure 5 compare the values of concentrations of DOM estimated by TOC carbon analyzer and UV–visible spectrophotometer at 272nm. A strong linear correlation (R2=0.99) exists between these two methods.
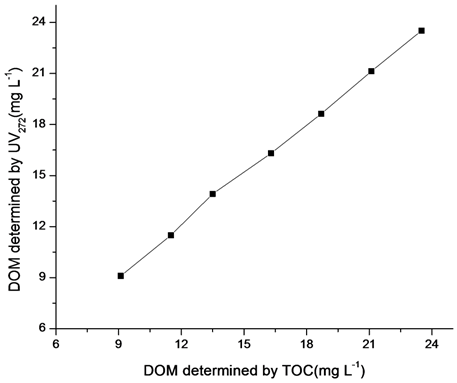
The higher correlation relationship of DOM with absorbance demonstrates that this technique should be used for assessment of concentration of DOM and it is very suitable and economical for estimation of DOM in water from sediment. Because other techniques like Chemical oxygen method and TOC analyzer techniques are more time consuming, expensive, and need more sophisticated instruments, this method is interesting because it only requires a UV–visible spectrophotometer. Another benefit is that in normal working range of pH no need to use buffer solution because changes of pH within normal working ranges has no effect on this technique.
4. Conclusion
The most favorable correlation coefficient (R2= 0.98) wavelength range is obtained among 270nm and 280nm by adding all the data to correlation regression analysis. There is high correlation coefficient (R2= 0.98) at specific wavelength 272nm between the wavelength (270–280nm) and absorbance by using UV–visible spectrophotometer. The correlations of DOM with absorbance indicate that this method should be used for estimation of concentration of DOM in water form sediment. This method has benefit over general techniques for estimation of DOM concentrations with less time consumption. It is also valuable in normal working pH range (3–11).
Acknowledgements
This work was supported by the Land and Resources Scientific Research of China from special fund (20111020) in the public interest, the project titled "survey and assessment of groundwater pollution in main cities of Northwestern China (1212011220982)" and "NPU Foundation for Fundamental Research (NPU-FFR-JCR20130145)".
References
[1] J. Dilling, K. Kaiser "Estimation of the hydrophobic fraction of dissolved organic matter in water samples using UV photometry" Water Research, 36(20), 2002, pp. 5037–5044. View Article
[2] K. Shamshad, W. Yaoguo, Z. Xiaoyan, H. Sihai, L. Tao, F. Yilin, L. Qiuge "Influence of dissolved organic matter from corn straw on Zn and Cu sorption to Chinese loess" Toxicological & Environmental Chemistry, 95(8), 2013, pp. 1318-1327. View Article
[3] G.S. Wang, S.T. Hsieh "Monitoring natural organic matter in water with scanning spectrophotometer" Environment International, 26(4), 2001, pp. 205–212. View Article
[4] H.O. Neung, A.P. Brian, A.M. Philip, J.H. Peter, M.B. Sandra, O. Noriaki, M.L. Kavvas, A.B. Brian, R.H. William "The role of irrigation runoff and winter rainfall on dissolved organic carbon loads in an agricultural watershed" Agriculture, Ecosystems and Environment, 179(1), 2013, pp.1– 10. View Article
[5] E.R. Newall, F.D. Hulot, J.L. Janeau, A. Merroune "CDOM fluorescence as a proxy of DOC concentration in natural waters: a comparison of four contrasting tropical systems" Environmental Monitoring and Assessment, 186(1), 2014, pp.589–596. View Article
[6] G. Rachel, J.H. Peter, W. Naomi, F. Christopher "Dissolved organic carbon and trihalomethane precursor removal at a UK upland water treatment works" Science of the Total Environment. 468–469(1), 2014, pp.228–239. View Article
[7] A.L. Bonnie, M.C. Rose, S.W. Howard "Changes in dissolved organic matter fluorescence and disinfectionbyproduct formation from UV and subsequent chlorination/chloramination" Journal of Hazardous Materials, 264(1), 2014, pp. 411– 419. View Article
[8] G. Crozes, P. White, M. Marshall "Enhanced coagulation: its effect on NOM removal and chemical costs" Journal American Water Works Association, 87(1), 1995, pp. 78–89. View Article
[9] J.G. Jacangelo, J. Demarco, D.M. Owen, S.J. Randtke "Selected processes for removing NOM: an overview: Natural organic matter" Journal American Water Works Association, 87(1), 1995, pp. 64–77. View Article
[10] S.J. Randtke "Organic contaminant removal by coagulation and related processes combinations" Journal American Water Works Association, 80(5), 1988, pp. 40–56. View Article
[11] R.F. Christman, D.L. Norwood, Y. Seo, F.H. Frimmel "Humic substances: II. In search of structure" In: Hayes, M.H.B., Mac-Carty, P., Malcolm, R.L., Swift, R.S. (eds).Publishing Wiley, Chichester, England, 1985, pp. 451–463. View Article
[12] G.G. Choudhry "Humic substances, structural, photophysical, photochemical and free radical aspects and interactions with environmental chemicals" Gordon & Breach, New York, 1984, pp. 98–106. View Article
[13] D.A. Reckhow, P.C. Singer, R.L. Malcolm "Chlorination of humic materials: byproduct formation and chemical interpretations" Environmental Science & technology, 24(11), 1990, pp. 1655–1664. View Article
[14] I.N. Najm, N.L. Patania, J.G. Jacangelo, S.W. Krasner "Evaluating surrogates for disinfection byproducts" Journal American Water Works Association, 86(6), 1994, pp.98–106. View Article
[15] A. Eaton "Measuring UV-absorbing organics: a standard method" Journal American Water Works Association, 87(2), 1995, pp.86–90. View Article
[16] P. Roccaro, F.G.A. Vagliasindi "Differential vs. absolute UV absorbance approaches in studying NOM reactivity in DBPs formation: Comparison and applicability" Water Research, 43(3), 2009, pp.744–750. View Article
[17] N. Ates, U. Yetis, M. Kitis "Effects of Bromide Ion and Natural Organic Matter Fractions on the Formation and Speciation of Chlorination By-Products" Journal of Environmental Engineering, 133(10), 2007, pp.947–954. View Article
[18] S.J. Traina, J. Novak, N.E. Smeck "An ultraviolet absorbance method of estimation of the percent aromatic carbon of humic acids" Journal of Environmental Quality, 19(1), 1990, pp. 151– 153. View Article
[19] Y.P. Chin, G. Aiken, E. O'Loughlin "Molecular weight, polydispersity, and spectroscopic properties of aquatic humic substances" Envorimental Science & technology, 28(11), 1994, pp.1853–1858. View Article