International Journal of Environmental Pollution and Remediation (IJEPR)
ISSN: 1929-2732

Volume 1 - Year 2012 - Pages 67-74
DOI: 10.11159/ijepr.2012.010
Electrokinetic Remediation with Solar Power for a Homogeneous Soft Clay Contaminated with Copper
Ikrema Hassan1, Eltayeb Mohamedelhassan2
1Department of Civil and Environmental Engineering, Western University
1151 Richmond Street, London, Ontario, N6A 3K7 Canada
imohame5@uwo.ca
2Department of Civil Engineering, Lakehead University
955 Oliver Road, Thunder Bay, Ontario, B7P 5E1 Canada
eltayeb@lakeheadu.ca
Abstract - This experimental study used solar cells to generate electric field for electorkinetic remediation of a soft clay soil contaminated with copper. Three solar cell panels with peak outputs of 13.5, 27, and 41 V were connected to identical electrokinetic cells to investigate the effectiveness of electrokinetics to remove the copper after 168 hr of remediation. A control test was carried without electric field to provide a baseline data. The results showed that solar cells can provide sufficient electric field for electrokinetic remediation. It was found that electroosmosis was effective in removing water from the contaminated soil while the removal of copper was primarily due to electromigration. The removal efficiency was proportional to the applied voltage and distance from electrode. The maximum removed copper was 86% of initial concentration occurred near the anode.
Keywords: Electrokinetic, Solar Cells, Clay, Copper
© Copyright 2012 Authors - This is an Open Access article published under the Creative Commons Attribution License terms. Unrestricted use, distribution, and reproduction in any medium are permitted, provided the original work is properly cited.
1. Introduction
Electrokinetic remediation technique aims to remove inorganic and organic pollutants such as heavy metals and hydrocarbons from low permeability contaminated soils using direct current (DC) electric field (Virkutyte et al., 2002). In this technique, the contaminants are mobilized and eventually recovered by passing a low-level DC between a row of positively charged electrodes (anode) and a row of negatively charged electrodes (cathode) inserted into the ground (Acar and Alshawabkeh, 1993; Lynch et al., 2007). According to Page and Page (2002), the low current is used in electrokinetic remediation processes for the safety of personnel and to avoid adverse heating effects. An electrokinetic remediation process can be time consuming and the energy expenditure during the process may become a major issue restricting wide field applications of the technology. Very few researches have been conducted to resolve the high energy cost associated with the electrokinetic remediation (e.g. Yuan et al., 2009).
The application of DC electric filed establishes electric potential gradient between the two electrodes (i.e. the anode and cathode), which generate electroosmosis flow. In addition, it initiates electromigration of species available in the soil pore fluid. Electroosmosis is defined as the movement of water in the soil pore from the anode to the cathode and electromigration is the movement of ions in the pore fluid towards the oppositely charged electrode. The total contaminant flux for the ith contaminant, Ji, under an applied electric potential can be calculated as (Acar and Alshawabkeh, 1993; Reed et al., 1996):
|
|
(1) |
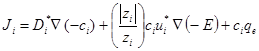
where Di* (cm2/s) is the effective diffusion coefficient, ci (mg/l) is the concentration of contaminant i, zi is the valence of contaminant i, ui* (cm2/V s) is the effective ionic mobility of contaminant i, E (V) is the electric potential, and qe (cm/s) is electroosmosis flux.
The first term on the right hand side of Eq. (1) quantifies the transport of the contaminant due to the concentration gradient (i.e. diffusion). The second and the third terms represent the contaminant transport by electromigration and electroosmosis, respectively.
The mass flux by electromigration in most cases is at least one order of magnitude greater than that by diffusion (Acar and Alshawabkeh, 1993). The effective ion mobility, which quantifies electromigration, is a function of the contaminant's molecular diffusion coefficient, valence, soil porosity, and tortuosity. The effective ionic mobility of species i, ui* (cm2/V s), is given by (Koryta, 1982):
|
|
(2) |
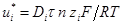
where Di (cm2/s) is the diffusion coefficient of ion species i in dilute solution, F (96487 C/mol) is the Faraday's constant, R (8.314 J/(mol K)) is the universal gas constant, T (K) is the absolute temperature, τ is the tortuosity factor, and n is the porosity of the soil.
Electroosmosis flux, qe (cm/s), and electroosmotic flow rate, Qe (cm3/s), are given by:
|
qe = ke∇(-E) |
(3) |
and
|
Qe = qeA |
(4) |
where ke (cm2/V s) is the coefficient of electroosmotic permeability, A (cm2) is the cross-sectional area perpendicular to the direction of flow.
Along with electromosmosis and electromigration, electrolysis reactions occur at the electrodes in an electrokinetic process. The reactions result in oxidation at the anode generating an acid front and reduction at the cathode producing a base front:
|
Anode: 2H2O – 4e- → O2 (g) + 4H+(aq) |
(5) |
|
Cathode: 2H2O + 2e- → H2 (g) + 2 OH- (aq) |
(6) |
Cost effective electrokinetic remediation of contaminated soil should involve the use of low cost electric power. One of the alternatives is the power generated by solar cells. Electrokinetics requires DC electric field and therefore electric transformers are used to convert alternating current (AC) to direct current (DC) before it can be used in an electrokinetic remediation process. Solar cells generate DC, rather than AC, which makes an excellent alternative to generate the electric power required for the electrokinetics. Solar power can be the most viable option for electrokinetic remediation of contaminated sites located in remote areas where power supply lines are absent or insufficient. Finally, solar power is environmentally friendly, which is very attractive for remediation. Over the last decade, the initial cost of a solar power system has been declining and this trend is expected to continue as the price of solar cells decreases and the efficiency increases. A recent study by Yuan et al. (2009) concluded that in Chain the cost of electrokinetic remediation with solar cell panels was 40% of that carried by electric power from the grid.
The power generated by solar cells depends on the climate conditions and the location. This can cause fluctuation in the power supply during the day and intervals of zero power at night. In previous studies of electrokinetic treatment, the variations in the supplied power by executing predetermined on and off periods during process was found to be beneficial to the effectiveness of the treatment (e.g. Reddy and Saichek, 2004; Mohamedelhassan and Shang, 2001). Accordingly, the use of solar power in electrokinetic remediation has the potential to be economical and effective in addition of being the most environmentally friendly option.
In this study, solar cell panels were used to generate the electric field required for an electrokinetic remediation of contaminated clay soil. Copper was used to artificially contaminate the soil. Solar panels with varying maximum output were used in the tests. The objectives of the study are to examine the efficiency of the electric field generated by solar cells and to evaluate the influence of the applied voltage in the effectiveness of electrokinetic remediation.
2. Experimental Program
2.1. Soil Properties
The clay soil used in this study was obtained from Plainsman Clay in Medicine Hat, Alberta. X-ray diffraction analysis for the soil revealed that kaolinite is the predominant clay mineral. The Unified Soil Classification System (USCS) group symbol of the soil is CL and the group name is lean clay. Table 1 summarizes the properties of the soil.
Table 1. Properties of the clay soil.
|
Properties |
|
|
Liquid limit |
41 |
|
Plastic limit |
19 |
|
Water content (%)* |
41 |
|
Sand (%) |
0 |
|
Silt (%) |
58 |
|
Clay (%) Specific gravity |
42 2.64 |
|
Organic content (%) |
0 |
|
Cation Exchange Capacity |
8.9 meq/100g |
*water content of specimens after preparation
2.2. Experimental Apparatus
The experimental equipment consisted of four identical electrokinetic remediation cells, three solar cell panels, and pore fluid squeezer cell. Three of the four electrokinetic cells were connected to solar cell panels while one cell was left unconnected to any power source to serve as a control.
The general design considerations of the electrokinetic cell, designed and fabricated for the study, were:
- i. Vertical electrodes configuration. The vertical electrodes layout was selected for its practicality in field installation and the ease of replacing electrodes.
- ii. Capability to apply a surcharge load to the soil specimen. The surcharge load can be used to simulate in-situ stress conditions, and to produce soil samples with various void ratios.
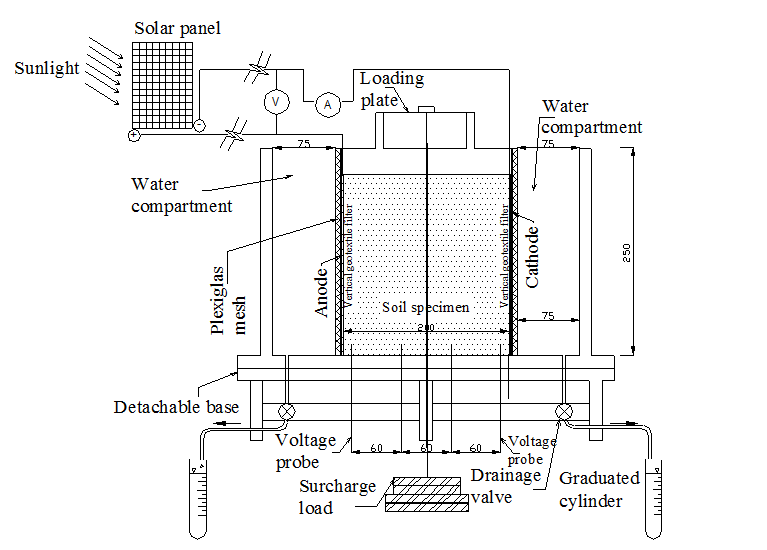
The electrokinetic remediation cell, constructed of clear Plexiglas plates 15 mm in thickness, has inner dimensions of 385×125×250 mm (length × width × height). The cell is consisted of upper part, base, and two movable perforated rectangular Plexiglas (250 mm length × 125 mm width). The upper part forms outer boundary to accommodate the soil sample. The perforated Plexiglas plates are used to adjust the soil sample length between 200 mm and 320 mm. The base of the cell is detachable to allow for easy recovery and minimum disturbance for the soil samples that to be used for subsequent parametric studies. Two drainage valves, used to collect water during the remediation process, were installed at the far ends of the base. The voltage across the soil specimen during the test is monitored via four voltage probes installed along the base of the cell. Figure 1 shows the schematic of the electrokinetic remediation cell.
Three solar cell panels were used as power supply. The cell dimensions are 1590 × 820 mm. The open circuit voltage and the maximum current are 41 V, and 4.27 A, respectively.
Soil pore fluid squeezer cell was especially designed and manufactured to recover pore fluid from soil specimens for subsequent testing. It composes of steel chamber to host the soil sample, steel piston to exert pressure on the soil sample and a base. A porous plate is place on the upper portion of the base and underlain by a drainage line grove through the base. The chamber inner dimensions are 50 mm in diameter and 100 mm long.
2.3. Testing Procedure
In this study, copper was the heavy metal used to artificially contaminate the soil. Copper was selected due to abundance of sites contaminated with copper and the ease of handling. The copper salt was copper (II) chloride dihydrate (CuCl2.2(H2O)). First, the clay soil was weighted and the volume of water required for water content of 41% (similar to the liquid limit of the soil) was measured and poured in a container. Copper (II) chloride dihydrate was then added to the container to achieve concentration of 150 mg of copper per kg of dry soil. The soil specimen was prepared by thoroughly stirring the soil with the copper solution using a mechanical mixer. The soft contaminated soil was poured in heavy duty plastic bags and placed on bails with airtight covers. The contaminated soil was stored to allow for a copper adsorption from the soil pore fluid to take place and reach equilibrium.
One dimensional electrokinetic remediation was performed in this study. Two perforated graphite electrodes, one serving an anode and the other as the cathode were placed 200 mm apart in direct contact with the soil in each of the three electrokinetic cells. The electrodes covered the entire cross-sectional area of the soil under remediation and therefore, the electric field was uniform across the area (i.e. one dimensional electric field). Two geotextile filters were wetted by tap water and placed between the electrodes and the Plexiglas. Seventy-two hours after pre-contaminated soil equal amounts of the soil were placed into the four cells in three layers for a total height of 165 mm. Each layer was rodded 25 times using steel rod, 16 mm in diameter and 600 mm long with a hemispherical shaped tip, to prevent the entrapment of air buckets. The high water content of the soil and the thorough rodding during placement in the cell insured that the soil specimen was nearly, if not fully, saturated. A surcharge load of 12.8 kg (corresponding to a pressure of 5 kPa) was applied to the soil via the loading plate in four increments over a period of four days. The first surcharge load was 0.6 kg, followed by 3 kg, 5 kg, 7.8 kg and 12.8 kg.
The longitude and latitude of Thunder Bay, Ontario, where the experiments were performed, are 89°14' W and 48°24' N, respectively. During the remediation the solar cell panels were mounted on wooden frames. The wooden frames were placed in a fenced uncovered yard and tilted at an angle of 48° to the ground surface for maximum exposure with the bottom of the cell elevated 250 mm from the ground. Each of the three solar cell panels was connected to the graphite electrodes in the three electrokinetic cells, Cell A, Cell B, and Cell C placed in a basement-floor laboratory about 100 m from the yard. The solar cell panels connected to Cell A and Cell B were partially covered to maintain peak applied voltages of 13.5 V and 27 V, respectively. The maximum potential gradients across Cell A, Cell B, and Cell C were 67.5, 135, and 205 V/m, respectively. A control test, Cell D, with no applied electric field was carried out to provide baseline data for comparison. The experiments were carried, in July 2010, for a period of seven days. Electric current, voltage across the soil, and water collected in a graduated cylinder were monitored and reported during the test.
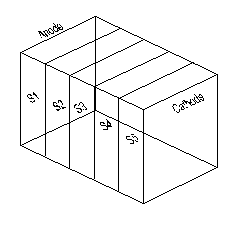
At the end of each test, the soil was extruded from the cell and divided into 5 equal sections, S1, S2, S3, S4, and S5 between the anode and the cathode (see figure 2). The soil from each section was tested for water content in accordance with ASTM D2216-10 (2010). Part of the soil in each section was squeezed and the soil pore fluid was collected. The pH and electrical conductivity of the pore fluid were determined and the copper concentration was obtained using Inductively Coupled Plasma-Optical Emission Spectrometry (ICP-OES). The pH in the dry soil was measured according to ASTM D4972-01 (2007). To determine copper concentration in the soil, 2.2 g of soil sample was air-dried for 48 to 72 hr and grounded and mixed with 11 ml of concentrated nitric acid. The mixture was agitated in a digital shaker for 1 hr at 150 rpm. Afterward, the mixture was centrifuge for 20 min at 5000 rpm. The concentration of copper in the supernatant was then determined using ICP-OES.
3. Results and Discussion
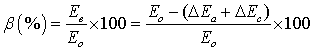
3.1. Applied Voltage and Electric Current
Figure 3 shows the profile of applied voltage and electric current during the electrokinetic remediation of Cells A, B, and C. The zero values are corresponding to the night time. The applied voltage and electric current vary during the daytime according to the degree of lightness and exposure. As seen in the figure, the applied voltage and current had rapidly increased after the sunrise (6 am), and peaked during the day (i.e. between 10 am and 4 pm). Afterward, the voltage and current started to decrease and diminished shortly after sunset.
From Figure 3a, the peak voltages were 13.5 V for Cell A, 27 V for Cell B, and 41 V for Cell C and were consistent during the peak hours for the seven days of remediation. At the period of maximum applied voltages, the corresponding current maximum values (0.12, 0.34 and 0.59 A for Cells A, B and C, respectively) were found to be on the first day of remediation and the minimum values (0.06, 0.10, and 0.15 A) were reported on the last day of remediation as shown in Figure 3b. It is worth mentioning that the current produced by the solar cells is considered sufficient for the electrokinetic remediation processes as per previous effective electrokinetic applications. For examples, Mohamedelhassan et al. (2010) had successfully used similar current values (0.17 to 0.65 A) for soil with identical surface areas to remove copper from contaminated clayey soil. Accordingly, the solar cells were able to generate power adequate for electrokinetic remediation. The decrease in current resulted from the decrease in electrical conductivity of the soil during the remediation process.
From Figure 3a, the peak voltages were 13.5 V for Cell A, 27 V for Cell B, and 41 V for Cell C and were consistent during the peak hours for the seven days of remediation. At the period of maximum applied voltages, the corresponding current maximum values (0.12, 0.34 and 0.59 A for Cells A, B and C, respectively) were found to be on the first day of remediation and the minimum values (0.06, 0.10, and 0.15 A) were reported on the last day of remediation as shown in Figure 3b. It is worth mentioning that the current produced by the solar cells is considered sufficient for the electrokinetic remediation processes as per previous effective electrokinetic applications. For examples, Mohamedelhassan et al. (2010) had successfully used similar current values (0.17 to 0.65 A) for soil with identical surface areas to remove copper from contaminated clayey soil. Accordingly, the solar cells were able to generate power adequate for electrokinetic remediation. The decrease in current resulted from the decrease in electrical conductivity of the soil during the remediation process.
The effect of applied voltage on the voltage loss at the soil-electrode interfaces was examined. For the three voltages used in the tests, the drops in voltage at the soil-anode and soil-cathode interfaces were measured. Electric potential efficiency factor, β, is introduced to quantify voltage loss at the soil-electrode interfaces as:
|
|
(7) |
where Ee (V) is effective voltage, Eo (V) is the applied voltage, ΔEa (V) is the voltage drop at soil-anode interface, and ΔEc (V) is the voltage drop at soil-cathode interface.
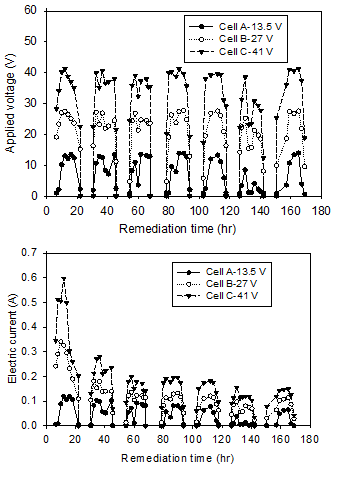
Figure 4 a, b and c shows the applied voltage (Eo) and the efficiency factor (Δ) during the first day of the remediation a cross Cell A (13.5 V), Cell B (27 V), and Cell C (41 V), respectively. The results showed that in general Δ increased with the increase in the applied voltage and reach a maximum value during the peak voltage. During the daytime in the first day of the test, Δ varied between 5 and 79% for Cell A (13.5 V), 72% and 89% for Cell B (27 V), and 76 to 90% for cell C (41 V). The reported increase in Δ with the increase in Eo is in agreement with a previous study by Mohammedelhassan and Shang (2001).
3.2. Water Collected and Water Content
The cumulative volume of water drained from the soil during the electrokinetic remediation is shown in Figure 5. As seen in the figure, cumulative volumes of 493, 960, and 1024 ml were collected by the end of the electrokinetic remediation test from Cells A, B and C, respectively with the volume increasing with the increase of applied voltage compared to only 124 ml in the control test (Cell D). The much larger volumes collected in the electrokinetic remediation tests were due to electroosmotic flow. The volume of water collected in the control test was due to pressure exerted on the soil by the surcharge load alone (i.e. consolidation), while the water collected in the tests with electrokinetic remediation was due to the effects of electroosmosis along with the consolidation.
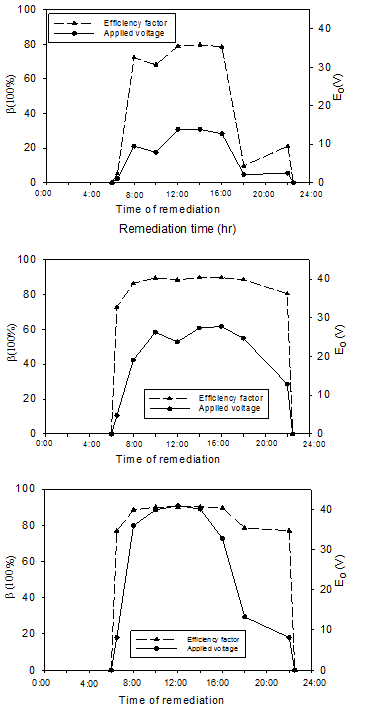
Figure 5 shows the volume of water collected during the early hours of the remediation, i.e. immediately following the 72 hr of loading, to be higher than that during the late hours of the remediation. This is to be expected as more water was available at the start of the remediation process. At the end of the test, the difference between the volumes of water collected from Cells B and A was 467 ml compared to difference of only 64 ml between Cells C and B. The results showed that increasing the voltage by 100% increased the volume of water drained by electroosmosis by 95% for voltage between 13.5 and 27 V. However, increasing the voltage from 27 V to 41 V (52%) had only resulted in an increase of 6% in the volume of drained water. The concentrations of the copper in water collected after electrokinetic remediation in Cells A, B, and C were 43.8 μg/l, 40.1μg/l, and 28.7 μg/l, respectively, representing a negligible amount (< 0.01%) of the initial mass of the metal. This means while electroosmosis was effective in draining the contaminated soil from water, the amount of copper in the drained water was negligible.
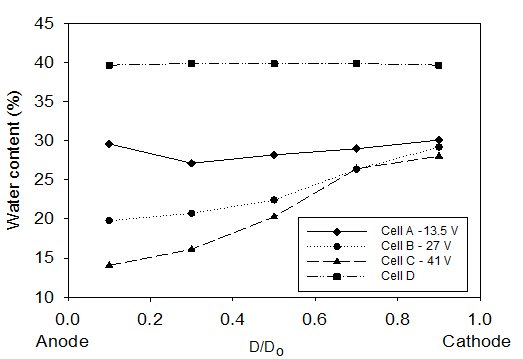
Figure 6 shows the water content in sections S1, S2, S3, S4, and S5 along the soil specimens (see Figure 2). D is the horizontal distance between the mid of the soil specimen and the anode and Do is the total length of the soil samples. Thus, the water content at 0.1 D/Do represent the layer near the anode (S1) while at 0.9 D/Do represents the layer near cathode (S5). Consistent with the higher volume of water drained by electroosmosis, lower water contents were observed after electrokinetic remediation as compared with the control test. Figure 6 shows that after electrokinetic remediation, the water contents along the soil specimen in Cells C and B were lower than the water contents in Cell A. This was to be expected as more water was drained in Cell C and B (see Figure 5).
Figure 6 show the water content at 0.7 D/Do (i.e. ∼75 mm from the cathode) remained high and relatively similar to the water content at 0.9 D/Do (i.e. ∼25 mm from the cathode). The high water content at 0.7 D/Do was a result of the water generated when the acid and base front, generated by electrolysis reactions at the anode and cathode shown by Eqs. (5) and (6), meet (see Figure 7). The acid front generated at the anode travels toward the cathode whereas the base front produced at the cathode travels toward the anode by electromigration. The H+ ions have smaller size than OH- ions and accordingly under the same potential gradient H+ ions travel longer distance through the soil than ions. In addition to electromigration, H+ ions travel by electroosmosis toward the cathode resulting in an acid-base junction closer to the cathode. As they meet, water is formed. The formation of water at the acid-base front junction in this study is in agreement with results in the literature (e.g. Narasimhan and Ranjan, 2000; Mohamedelhassan and Shang, 2003).
3.3. pH and Heavy Metal Concentration
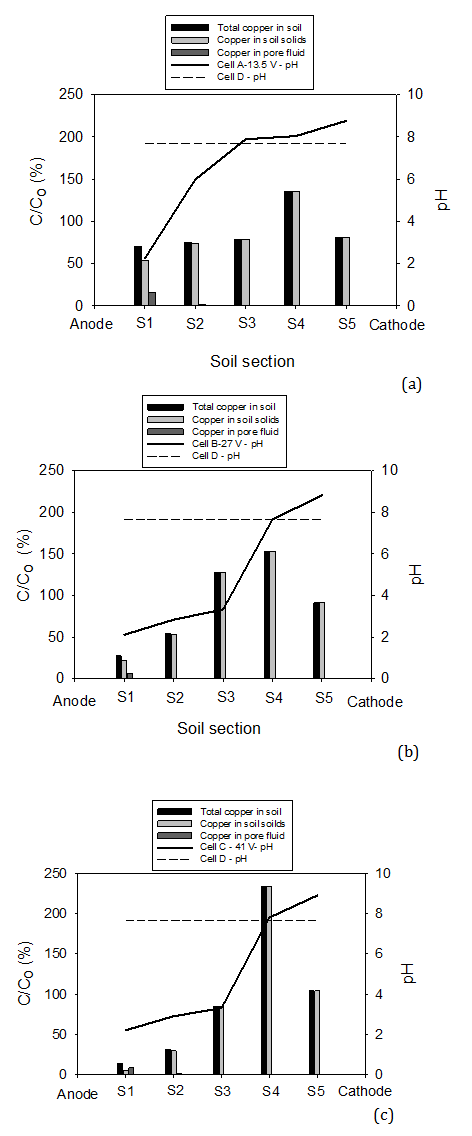
Figure 7a, b and c shows the pH along the soil specimen after the tests. The pH pH of the soil sample prior to the test was 7.6. The figure shows that for Cell D (control) the pH remained between 7.7 and 8 for all sections. For Cell A (13.5 V), the pH values were 2.1 and 6.2 for S1 (0.1 D/Do) and S2 (0.3 D/Do), respectively. The pH was > 7 for the rest of the soil. As shown in Figure 7b and c, the pH profile for Cell B (27 V) and Cell C (41 V) coincided and 60% of the soil (S1, S2, and S3) reported pH < 3.1 (i.e. acidic) with the lowest pH near the anode (2.1 and 2.2). The remaining 40 % (S4 and S5) of the soil reported pH > 7 and the highest pH of 9 was reported near the cathode in Cell C. The pH profile is in agreement with the electrolysis reactions at the electrodes and the distance travelled by the H+ and OH- ions. It can be concluded that at applied voltage of 27 V (135 V/m) and higher larger portion of the soil would become acidic while at a 13.5 V (67.5 V/m) the largest portion would become basic. The difference in pH values between the pore fluid pH and soil was found to be ±0.5. Heavy metals in a contaminated soil are more soluble in acidic environment and thereby easy to remove.
Figure 7a, b and c also shows the ratio (in percentage) of copper concentration in sections S1 to S5 after the electrokinetic remediation test (C) to the initial concentration in the soil (Co = 150 mg/kg of dry soil). The concentrations are presented for the total copper in the soil, the copper in pore fluid, and copper in soil solids. The figure clearly shows that the power generated by solar cells for electrokinetic remediation was in general effective in moving copper from the anode towards the cathode. The movement however, was proportional to the applied voltage.
The heavy metal removal from contaminated soil by electrokinetics is due to combine effects of electroosmosis and electromigration along with the change in the soil pH during the process. As discussed earlier, the amount of soluble copper in the water drained by electroosmosis in Cell B (27 V) and Cell C (41 V) was similarly negligible and the pH profiles and volume of water collected in the two tests were approximately similar (see Figures 5 and 7). Thus, higher copper removal from Cell C can be attributed to electromigration. Therefore, it can be concluded that the transport of copper in the clayey soil pore fluid depends principally on the electromigration. The dominance role of electromigration is in agreement with previous studies by Page and Page (2002) and Probstein (1994). In Cell C (41 V), the lowest concentration of total copper (copper in pore fluid and copper in soil solids) after the remediation was 14% of initial concentration (i.e. 86% of copper was removed) observed near the anode (i.e. S1). The copper concentration increases toward the cathode with a maximum of 256% of initial concentration at S4 (i.e. the location where acid and base fronts meet). As seen in Figure 7a, b and c, the highest copper concentration in soil pore fluid was observed near the anode and the concentration decreased towards the cathode. This is a result of the low pH near the anode which promotes copper dissolution and the high pH at the cathode which results in copper precipitation.
4. Conclusions
An experimental study was carried out to investigate the effectiveness of solar cells in generating electric power for electrokinetic remediation of clay soil contaminated with copper. The initial copper concentration was 150 mg/kg of dry soil. The tests were performed in four identical electrokinetic remediation cells. Three different voltages (13.5, 27, and 41 V) were applied during 168 hr of remediation. The results showed that:
- - Electric power from solar cells is a viable alternative for electrokinetic remediation of clayey soils.
- - Electroosmosis flow was effective in removing water from the soil pores and the amount of copper in the drained water was negligible.
- - The pH profile along the cells after electrokinetic remediation was consistent with the electrolysis reactions.
- Electromigration was effective in removing significant amount of the heavy metal from about 50% of the contaminated soil with the highest removal of 86% near the anode.
- The copper removal rate was proportional to the applied voltage.
Acknowledgements
The research is funded by Natural Science and Engineering Research Council of Canada.
References
Acar, Y. B., Alshawabkeh, A. N. (1993). Principles of electrokinetic remediation. Environmental Science and Technology, 27(3), 2638-2647. View Article
ASTM (2007). "Standard Test Method for pH of soils." Annual Book of ASTM Standards, D4972-01, ASTM, PA, US. View Article
ASTM (2010). "Standard Test Methods for Laboratory Determination of Water (Moisture) Content of Soil and Rock by Mass." Annual Book of ASTM Standards, D2216-10, ASTM, PA, US. View Article
Koryta, J. (1982). Ions, Electrodes, and Membranes. John Wiley and Sons, Inc., New York. View Article
Lynch, R. J., Muntoni, A., Ruggeri, R., Winfield K. C. (2007). Preliminary tests of an electrokinetic barrier to prevent heavy metal pollution of soils. Electrochimica Acta, 52, 3432-3440. View Article
Mohamedelhassan, E., Mohamed Ahmed, I., Mahmoud, A. (2010). Electrokinetic remediation of soft clay soil contaminated with heavy metals. Proceedings of 63rd Canadian Geotechnical Conference & 6th Canadian Permafrost Conference, Calgary, Canada, Sept 12-16, pp. 1192-1196.
Mohamedelhassan, E., Shang, J. Q. (2003). Electrokinetics-generated pore fluid and ionic transport in an offshore calcareous soil. Canadian Geotechnical Journal, 40(6), 1185-1199. View Article
Mohamedelhassan, E., Shang, J. Q. (2001). Effects of electrode materials and current intermittence in electro-osmosis. Ground Improvement, 5(1), 3-11. View Article
Narasimhan, B., Ranjan, R. S. (2000). Electrokinetic barrier to prevent subsurface contaminant migration: theoretical model development and validation. Journal of Contaminant Hydrology,42(1), 1-17. View Article
Page, M. M., Page, C. L. (2002). Electroremediation of contaminated soils. Journal of environmental Engineering, ASCE, 128(3), 208-219. View Article
Probstein, R. F. (1994). Physicochemical Hydrodynamics: An Introduction, 2nd Edition. John Wiley and Sons, Inc., New York.
Reddy, K. R., Cameselle, C. (2009). Electrochemical remediation technologies for polluted soils, sediments and groundwater. John Wiley and Sons, Inc., Hoboken, New Jersy, USA. View Article
Reddy, K. R., Saichek, R. E. (2004). Enhanced electrokinetic removal of phenanthrene from clay soil by periodic electric potential application. Journal of Environmental Science and Health Part a-Toxic/Hazardous Substances & Environmental Engineering, 39(5), 1189-1212. View Article
Reed, B. E., Carriere, P. C., Thompson, J. C., Hatfield, J. H. (1996). Electronic (EK) remediation of a contaminated soil at several Pb concentrations and applied voltages. Journal of Soil Contamination, 5(2), 95-120. View Article
Virkutyte, J., Sillanpaa, M., Latostenmaa, P. (2002). Electrokinetic soil remediation-critical overview. Science of the Total Environment, 289(1-3), 97-121. View Article
Yuan, S. H., Zheng, Z. H. (2009). Use of solar cell in electrokinetic remediation of cadmium-contaminated soil. Journal of Hazardous Materials, 162(2-3), 1583-1587. View Article