International Journal of Environmental Pollution and Remediation (IJEPR)
ISSN: 1929-2732

Volume 2 - Year 2014 - Pages 45-51
DOI: 10.11159/ijepr.2014.007
Investigation of Watershed-scale Surface Water Quality under Changing Land Use Conditions: A Case Study in Northern British Columbia
Gopal Chandra Saha, Jianbing Li*, Siddhartho Shekhar Paul, Ronald W Thring
Environmental Engineering Program, University of Northern British Columbia,
3333 University Way, Prince George, British Columbia, Canada V2N 4Z9
saha@unbc.ca; jianbing.li@unbc.ca; pauls@unbc.ca; thring@unbc.ca
Abstract - The effects of land use change on surface water quality in an intensively used watershed in northern British Columbia were investigated. The water of the Kiskatinaw River watershed (KRW) was analyzed for its total organic carbon (TOC) concentration in 2004-2005 and 2010-2011, and the variation of water quality within sampling sites over time was examined. The results showed that TOC concentrations in 2010-2011 were lower than those in 2004-2005 due to decreased degradation of terrestrial vegetation, agricultural activities, and the loss of wetlands, as well as the strict regulation of industrial discharge from 2004-2005 to 2010-2011 in KRW. It was found that TOC concentrations were high in the agriculturally intensive sites. In addition to land use, the data indicated that more rainfall led to higher TOC concentrations at the nearby stream/river during spring runoff and summer due to more surface runoff and erosion. The land use change effects were more dominant on TOC concentration variation than stream flow.
Keywords: Kiskatinaw river watershed, land use, water quality.
© Copyright 2014 Authors - This is an Open Access article published under the Creative Commons Attribution License terms. Unrestricted use, distribution, and reproduction in any medium are permitted, provided the original work is properly cited.
Date Received: 2013-09-20
Date Accepted: 2014-03-22
Date Published: 2014-04-09
1. Introduction
Surface water quality is directly linked to the land cover of a watershed [1]. It can be degraded by changes in land cover due to various anthropogenic activities, resulting in threats to the aquatic ecosystem and posing serious challenges to drinking water supply authority [2,3]. For sustainable land use and resource management, it is crucial to understand how land use patterns affect surface water quality [4]. For example, Tong and Chen [5] found a positive correlation between the area of agricultural and urban lands and the loading of nitrogen and phosphorus within different watersheds in Ohio from 1988 to 1995. Smith et al. [6] found an increase of copper and zinc concentrations in a Canadian watershed from 1993-1994 to 2003-2004 due to an increase of agricultural activities. Lin et al. [7] found that the phosphorus loading in Lake Allatoona Watershed in USA increased by 17.5% from 1992 to 2001 due to a 20% decrease of forest area, a 225% increase of urban area, and a 50% increase of pasture area, respectively. Broussard and Turner [8] observed a significant increase of nitrate-nitrogen (NN) concentrations in 56 USA watersheds from 1900 to 2002 due to an increase in agricultural area. Huang et al. [9] found a negative correlation between the area of forest and grassland and the concentrations of total nitrogen (TN) and total phosphorus (TP) in Chaohu Lake Basin, China from 2000 to 2008, and they also observed a negative correlation between built up area and dissolved oxygen (DO) concentration in that basin.
The change in land cover and land management practices in a watershed have been recognized as major factors affecting its hydrological system which may then cause variation in its water quality [5]. The Peace Region in northern British Columbia in Canada is a diversified area where different types of land use activities (e.g., timber harvesting, agricultural, oil and gas, wildlife, and recreational) occur. However, very few research works have been reported which investigate the interaction between land use/land cover change and watershed-scale surface water quality variation in this region. The objective of this study is to fill this gap. The Kiskatinaw River Watershed (KRW) was used as a case study. The river water of KRW was analyzed for its total organic carbon (TOC) concentration in 2010-2011, and the water quality during this time period was then compared with that observed in 2004-2005, while land use changes from 2004-2005 to 2010-2011 were detected by using remote sensing analysis and Arc GIS.
2. Study Area
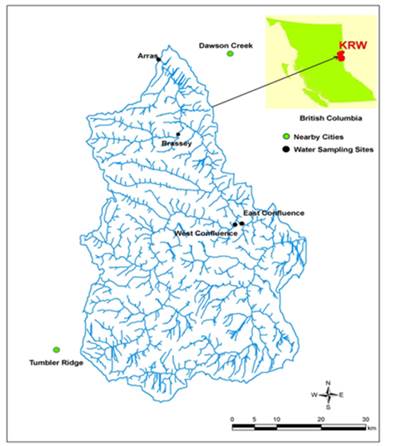
The Kiskatinaw River Watershed (KRW) is situated in northeastern British Columbia, Canada (Fig. 1), covering an area of about 2882 km2. The City of Dawson Creek provides drinking water to its inhabitants and industrial users by collecting and treating water from the Kiskatinaw River. The KRW is an intensively used watershed as a result of the large and increasing scale of timber harvesting, oil and gas exploration/production and urbanization in recent years. It is a rain-dominated hydrological system, with peak flow occurring from late June to early July. It receives an average annual precipitation of 499 mm which consists of 320 mm of rain and 179 mm of snow. The average annual river flow rate of the Kiskatinaw River is 10 m³/s, but the flow drops to 0.052 m³/s in January [10]. In this study, TOC was selected as a study water quality parameter because it plays an important role in stream chemistry [11] by complexing metals and nutrients [12], affecting pH and alkalinity [13, 14] and acting as a substrate for microbial production [15] . It contains all forms of organic carbon, including petroleum hydrocarbons and natural organic matter [16]. Excessive TOC in source water could lead to the formation of carcinogenic by-product such as trihalomethane (THMs) following chlorination treatment [17, 18].
3. Methods
3. 1. Water Quality Sampling
The British Columbia (BC) Ministry of Environment conducted a water quality study within KRW in 2004-2005 at four sampling locations (i.e., Arras, Brassey, East Confluence, and West Confluence) (Fig. 1)[19]. In the present study, water quality samples were collected in 2010-2011 at the same locations to measure the total organic carbon (TOC) concentrations. The Arras, East Confluence and West Confluence sites were sampled on seven occasions, and the Brassey site was sampled on six occasions. On two occasions, duplicate samples were collected at the same site and time in order to evaluate sample collection consistency [20]. The samples were collected using acid-washed 120-mL plastic bottles and stored in an ice-packed cooler, and were then sent to a certified laboratory for analysis. The TOC was measured using a Shimadzu (TOC-500) total organic carbon analyzer. The sampling and testing techniques used in 2010-2011 were consistent with those used in 2004-2005, and the variation of water quality between the two time periods was then examined.
3.2. Hydrological Data Collection and Land Use Maps
The precipitation data of KRW and stream flow data at Arras site (i.e., outlet of KRW) during 2004-2005 and 2010-2011 were collected from Noel weather station and Farmington Water Survey Canada station, respectively. The land use maps for 1999 and 2010 in the KRW were generated using remote sensing analysis and Arc GIS based on collected Landsat satellite image of that corresponding year. The details of land use map generation can be found in Saha et al. [21]. The large-scale shale gas exploration/production activities began in 2005 [22]. As a result, the land use maps of 2010 and 1999 were used to represent land use conditions in 2010-2011 and 2004-2005, respectively.
4. Results and Discussion
4. 1. Land Use Change Analysis
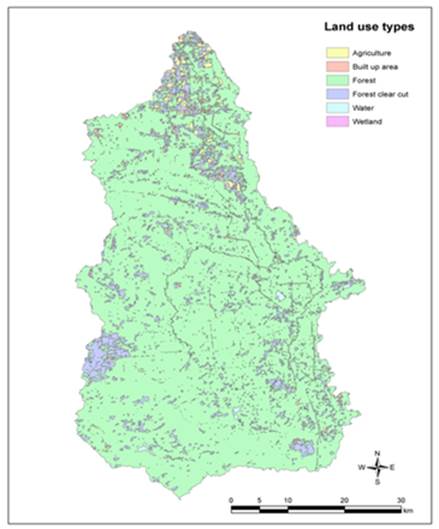
Fig. 2 presents the land use map for 2010-2011, and it was found that forests account for a major portion of the KRW. The land use change between 2004-2005 and 2010-2011 is shown in Table 1. It is seen that the major land use change was from forest clear cut and wetland. The "forest clear cut" area includes the forest cut block areas which were cleared by industry (e.g., oil and gas) or for other purposes. This land use class comprises most of the gas development infrastructure, including drilling pads. Forest clear cut area increased by about 268%, while wetland area decreased by about 97%. The rapid change in forest clear cut was primarily due to large scale oil/gas exploration/production, while the rapid change in wetland area may be due to the shift of vegetation and oil/gas exploration/production in the study area. It was also found that forest and built up area (e.g., road, house, industrial infrastructures) increased by about 4% and 106% from 2004-2005 to 2010-2011, respectively. The agricultural (e.g., cropland and pasture) and open water (e.g. river, small channels) areas decreased by 57% and 17%, respectively.
Table 1. Land use changes from 2004-2005 to 2010-2011 in KRW.
|
Land use condition |
Area (km2) in 2004/05 |
Area (km2) in 2010/11 |
Change (km2) |
Change (%) |
|
Forest |
2431 |
2531 |
100 |
4 |
|
Forest clear cut
|
66
|
243 |
177 |
268
|
|
Agriculture
|
99
|
43 |
-56 |
-57 |
|
Built up area
|
16 |
33 |
17 |
106 |
|
Water
|
29 |
24 |
-5 |
-17 |
|
Wetland
|
241 |
8 |
-233 |
-97 |
|
Total
|
2882 |
2882 |
|
|
4. 2. Precipitation and Stream Flow Trends
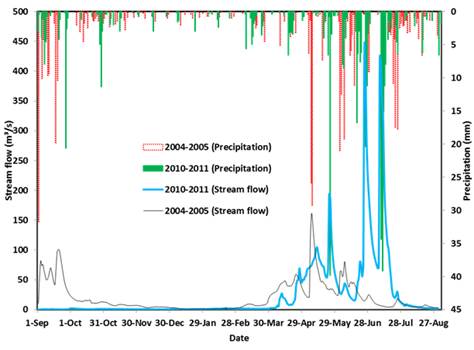
Fig. 3 shows the precipitation and stream flow in KRW from September 2010 to August 2011 and from September 2004 to August 2005.The annual precipitation in 2010-2011 and 2004-2005 was found to be 467 and 507 mm, respectively. The mean annual stream flow in 2010-2011 and 2004-2005 were 25.91 and 20.3 m3/s, respectively. It is to be noted that in June and July 2011, flooding occurred in KRW.
4. 3. Variation of Total Organic Carbon Concentration
The comparison of TOC concentrations at four sites between 2010-2011 and 2004-2005 is shown in Fig. 4. TOC concentrations at the Arras site (Fig. 4a) in 2010-2011 ranged from 4.3 to 13.5 mg/L, while in 2004-2005 they ranged from 7.3 to 17.7 mg/L. The median was 5.7 and 10 mg/L in 2010-2011 and 2004-2005, respectively. This illustrates a significant decrease of TOC concentrations at this site. The primary sources of TOC are natural sources (degradation of terrestrial vegetation, wetlands) as well as agricultural, industrial and residential waste discharges [19]. When terrestrial vegetation degrades, organic carbon can enter the soil. The surface runoff and erosion could then carry the organic carbon enriched soil into a nearby river/stream during snow melt and rainfall events. In general, TOC concentration is much higher in forested soils than agricultural soils [23, 24]. However, soil erosion rates from the agricultural area are higher than from the forest [25]. Therefore, a decrease in agricultural area could result in a decrease of soil carbon erosion [26] and thus a reduced TOC concentration in the nearby river/stream. In addition, several studies found that wetlands are the major contributor of TOC to streams and lakes [11, 27-30]. TOC enters wetland via groundwater and surface runoff from TOC enriched surrounding upland soils [31].
The decrease of TOC concentrations at the Arras site may be due to the decrease of the degradation of terrestrial vegetation, agricultural activities, the loss of wetlands in the KRW, and the increase of forest clear cut and built up area, as well as the strict regulations imposed on industrial discharges between these time periods. In 2007, British Columbia Ministry of Environment introduced the Oil and Gas Waste Regulation (OGWR) under the Environmental Management Act of British Columbia [32], which reduced the discharge of hydrocarbons from the oil/gas industry to the environment and thus resulted in lower TOC concentration in the study area. From 2004-2005 to 2010-2011, wetland and agricultural activities in the study area decreased by 97% (233 km2) and by 57% (56 km2), respectively. On the other hand, forest, forest cleat cut and built up area in the study area increased by 4% (100 km2), 268% (177 km2), and 106% (17 km2), respectively. Although forest area, which contains soils with highest TOC concentrations than agricultural soils, increased by 100 km2, TOC concentrations did not increase in the study area in 2010-2011. Due to the decrease of wetland, which is the main contributor of TOC to streams, by 233 km2 and agricultural area by 56 km2, TOC concentrations decreased in the study area in 2010-2011. These land use changes support the decrease of TOC concentrations in the KRW in 2010-2011. These results also correspond to the findings in other studies of changing TOC concentrations due to land use changes [30, 33-36].
It was also found that TOC concentrations at the Arras site were high in both 2004-2005 and 2010-2011 during high stream flow period, such as the high TOC concentrations observed during September 2004 and June 2011 when heavy rainfall events occurred. This indicates that more rainfall led to more TOC concentrations at the nearby stream/river during spring runoff and summer due to more surface runoff and erosion [25, 37]. In addition, the increase of forest clear cut (177 km2) and built up area (17 km2) intensified soil erosion rates by increasing surface runoff during heavy rainfall [38]. There was more precipitation in 2004-2005 than in 2010-2011, leading to higher TOC concentrations in 2004-2005 during spring runoff and summer. However, the higher mean annual stream flow in 2010-2011 than that in 2004-2005 occurred mainly due to flooding during June-July 2011(Fig. 3). Therefore, in August 2011 just following the flooding, TOC concentrations were higher than that in 2004-2005.
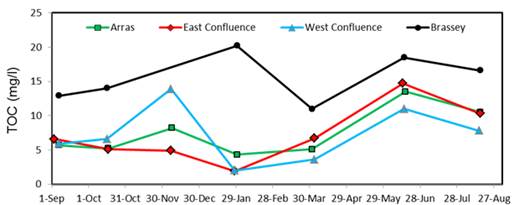
Fig. 4b shows that TOC concentrations at the East Confluence site in 2010-2011 ranged from 1.9 to 14.7 mg/L (with median of 5.1 mg/L), while in 2004-2005 they ranged from 9.5 to 18.2 mg/L (with median of 12.15 mg/L). The trend of TOC concentration variations at this site is almost similar to that of Arras site. TOC concentrations at the West Confluence site (Fig. 4c) in 2010-2011 ranged from 2 to 13.9 mg/L (with median of 5.9 mg/L), while in 2004-2005 they ranged from 5 to 14.3 mg/L (with median of 9 mg/L). TOC concentrations at the Brassey site (Fig. 4d) in 2010-2011 ranged from 11 to 20.2 mg/L (with median of 13.5 mg/L), while in 2004-2005 they ranged from 12 to 25.4 mg/L (with median of 17 mg/L). However, high TOC concentrations at the East and West Confluences, and Brassey sites were not observed in August just following the flooding, indicating that land use change effects were more dominant on TOC concentration variation.
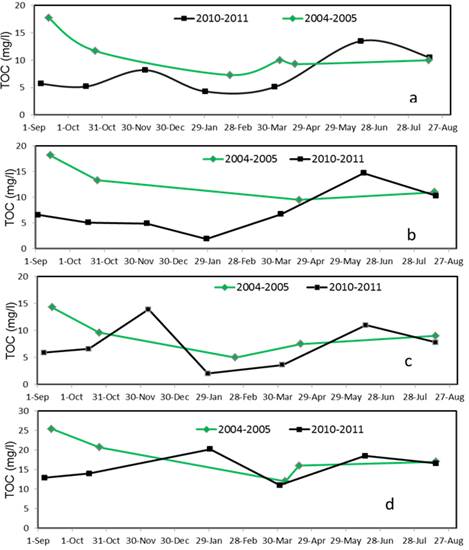
Fig. 5 shows the spatial variation of TOC concentrations in 2010-2011 in the KRW, and it can be found that the TOC concentrations were higher at the Brassey site compared to other sites. This may be caused by more agricultural activities and more degradation of terrestrial vegetation due to urban development (e.g., roads, roads crossing) in the Brassey area. In addition, soil erosion rates from the agricultural area are higher than from the forest [18], and urban development in the Brassey area intensified the soil erosion rates, which resulted in higher TOC concentration. Correll et al. [18] also found higher TOC concentration in agricultural watershed than forested watershed. TOC concentrations at the Arras site (i.e., outlet of the watershed) were also higher than that at the West Confluence site (upstream) because of discharge from Brassey with high TOC concentration to Arras.
5. Conclusion
This study investigated the effects of land use change on surface water quality in the Kiskatinaw River watershed in northern British Columbia. The river water was sampled at four locations in 2010-2011 for analyzing total organic carbon (TOC) concentrations. The water quality results were then compared with those observed in 2004-2005 by the BC Ministry of Environment. Land use changes from 2004-2005 to 2010-2011 were detected by using remote sensing analysis and Arc GIS. The results illustrated that land use change played a primary role in the reduction of TOC concentration in the river water. The results also indicated that TOC concentrations were high at the agriculturally intensive sites than other types of land uses due to higher soil erosion rates. In addition to land use change, rainfall played a secondary role in TOC concentrations in the nearby stream/river during spring runoff and summer due to more surface runoff and erosion. Therefore, the results obtained from this study will be helpful for making better land use management plan in watershed to control TOC concentration.
Acknowledgements
This study was funded by Peace River Regional District, the City of Dawson Creek, Geoscience BC, EnCana, and BP Canada. The authors would like to thank Faye Hirshfield, Peter Caputa, Reg Whiten, and Chelton van Geloven for their help and support.
References
[1] B.J. Amiri, A. Nakane "Modeling the linkage between river water quality and landscape metrics in the Chugoku District of Japan", Water Resource Management, 23 (5), 2009, 931-956. View Article
[2] L. Sliva, D.D. Williams "Buffer zone versus whole catchment approaches to studying land use impact on river water quality", Water Research, 35(14), 2001, 3462-3472. View Article
[3] E. Nagoye, J. Machiwa "The influence of land use patterns in the Ruvu River watershed on water quality in the river system" Physics and Chemistry of the Earth, Parts A,B,C, 29(15-18), 2004, 1161-1166. View Article
[4] Y.P. Khare, C.J. Martinez, G.S. Toor "Water quality and land use changes in the Alafia and Hillsborough River watersheds, Florida, USA" JAWRA Journal of the American Water Resources Association, 48(6), 2012, 1276-1293. View Article
[5] S.T.Y. Tong, W. Chen "Modeling the relationship between land use and surface water quality", Journal of Environmental Management, 66(4), 2002, 377-393. View Article
[6] I.M. Smith, K.J. Hall, L.M. Lavkulich, H. Schreier "Trace metal concentrations in an intensive agricultural watershed in British Columbia, Canada" JAWRA Journal of the American Water Resources Association, 43(6), 2007, 1455-1467. View Article
[7] Z. Lin, D.E. Radcliffe, L.M. Risse, J.J. Romeis, C.R. Jackson "Modeling phosphorus in the Lake Allatoona watershed using SWAT: II. Effect of land use change", Journal of Environmental Duality, 38(1), 2009, 121-129. View Article
[8] W. Broussard, R.E. Turner "A century of changing land-use and water-quality relationships in the continental US" Frontiers in Ecology and the Environment, 7(6), 2009, 302-307. View Article
[9] J. Huang, J. Zhan, H. Yan, F. Wu, X. Deng "Evaluation of the impacts of land use on water quality: a case study in the Chaohu Lake basin", the Scientific World Journal, 2013, 7 pages. View Article
[10] Dobson Engineering Ltd. and Urban Systems Ltd. Kiskatinaw River Watershed Management Plan; File 0714.0046.01, 2003. [Online] [Accessed on December 19, 2012]. View Article
[11] P.J. Dillon, L.A. Molot "Effect of landscape form on export of dissolved organic carbon, iron, and phosphorus from forested stream catchments" Water Resource Research, 33(11), 1997, 2591-2600. View Article
[12] E. Tipping "Modeling the competition between alkaline-earth cations and trace-metal species for binding by humic substances" Environmental Science & Technology, 27, 1993, 520–529. View Article
[13] D.F. Brakke, A. Henriksen, S.A. Norton "The relative importance of acidity sources for humic lakes in Norway" Nature, 329, 1987, 432–434. View Article
[14] H. Laudon, O. Westling, S. Lofgren, K. Bishop "Modeling preindustrial ANC and pH during the spring flood in northern Sweden" Biogeochemistry, 54, 2001, 171–195. View Article
[15] M. Jansson, A.K. Bergstrom, P. Blomqvist, S. Drakare "Allochthonous organic carbon and phytoplankton/bacterioplankton production relationships in lakes" Ecology, 81, 2000, 3250-3255. View Article
[16] C.G. Schreier, W.J. Walker, J. Burns, R. Wilkenfeld "Total organic carbon as a screening method for petroleum hydrocarbons" Chemosphere, 39(3), 1999¸503-510. View Article
[17] British Columbia Ministry of Environment (BCME). Ambient water quality criteria for organic carbon in British Columbia. 1998, [Online] [Accessed on January 12, 2014]. View Website
[18] United States Environmental Protection Agency (USEPA). Basic information about disinfection byproducts in drinking water: Total Trihalomethanes, Haloacetic Acids, Bromate and Chlorite, 2003. [Online] [Accessed on January 19, 2014]. View Website
[19] British Columbia Ministry of Environment (BCME). Water quality source identification in the Kiskatinaw Watershed near Dawson Creek, B.C. Interim report, 2006. View Article
[20] British Columbia Ministry of Water, Land and Air Protection (BCMWLAP). British Columbia Field Sampling Manual, 2003. [Online] [Accessed on December 19, 2012]. View Website
[21] G.C. Saha, S.S. Paul, J. Li, F. Hirshfield, J. Sui "Investigation of land-use change and groundwater-surface water interaction in the Kiskatinaw River Watershed, British Columbia (parts of NTS 093P/01, /02, /07-/10)", in Geoscience BC Summary of Activities 2012, Geoscience BC, Report 2013-1, 2013, p.139-148. View Article
[22] British Columbia Ministry of Energy and Mines (BCMEM). "The status of exploration and development activities in the Montney Play region of northern BC". [Online] [Accessed on December 19, 2012]. View Article
[23] B.H. Ellert, E.G. Gregorich "Storage of carbon, nitrogen and phosphorus in cultivated and adjacent forested soils of Ontario" Soil Sciences, 161, 1996, 587–60. View Article
[24] H.P. Apezteguia, R.C. Izaurralde, R. Sereno "Simulation study of soil organic matter dynamics as affected by land use and agricultural practices in semiarid Cordoba, Argentina" Soil Tillage Research, 102, 2009, 101-108. View Article
[25] D.L. Correll, T.E. Jordan, D.E. Weller "Effects of precipitation, air temperature, and land use on organic carbon discharges from Rhode River Watersheds" Water Air & Soil Pollution, 128, 2001, 139-159. View Article
[26] C. Boix-Fayos, J. de Vente, J. Albaladejo, M. Matinez-Mena "Soil carbon erosion and stock as affected by land use changes at the catchment scale in Mediterranean ecosystems" Agriculture, Ecosystems & Environment, 133, 2009, 75-85. View Article
[27] H.F. Hemond "Wetlands as the source of dissolved organic carbon to surface waters" In: Organic acids in aquatic ecosystems ed. by E. M. Perdue and E. T. Gjessing, John Whiley & Sons, 1990.
[28] D. Hope, M.F. Billett, M.S. Cresser "Exports of organic carbon in two river systems in NE Scotland" Journal of Hydrology, 193, 1997, 61–82. View Article
[29] H. Laudon, S. Kohler, I. Buffam "Seasonal TOC export from seven boreal catchments in northern Sweden" Aquatic Sciences, 66, 2004, 223-230. View Article
[30] J. Shih, R.B. Alexander, R.A. Smith, E.W. Boyer, G.E. Schwarz, S. Chung "An initial SPARROW model of land use and in-stream controls on total organic carbon in streams of the conterminous United States" U.S. Geological Survey Open-File Report 2010–1276, 2010, 22 p. View Article
[31] J.L. Richardson, J.L. Arndt, J.A. Montgomery "Hydrology of wetland and related soils" in JL Richardson & MJ Vepraskas (eds), Wetland Soils, Lewis Publishers, Boca Raton, 2001. View eBook
[32] British Columbia Ministry of Environment (BCME) Oil and gas waste regulation – users guide, 2007. [Online] [Accessed on January 24, 2014]. View Article
[33] L. Arvola, A. Ralke, P. Kortelainen, M. Jarvinen "The effect of climate and land use on TOC concentrations and loads in Finnish rivers" Boreal Environmental Research, 9, 2004, 381-387. View Article
[34] S. Bhat, J.M. Jacobs, K. Hatfield, J. Prenger "Relationships between stream water chemistry and military land use in forested watersheds in Fort Benning, Georgia" Ecological Indicators, 6, 2006, 458-466. View Article
[35] D. Enters, A. Lucke, B. Zolitschka "Effects of land-use change on deposition and composition of organic matter in Frickenhauser See, northern Bavaria, Germany" Science of the Total Environment, 369, 2006, 178-187. View Article
[36] P. Bragee, F. Mazier, P. Rosen, D. Fredh, A. Brostrom, W. Graneli, D. Hammarlund "Forcing mechanisms behind variations in total organic carbon (TOC) concentration of lake waters during the past eight centuries – palaeolimnological evidencs from southern Sweden" Biogeosci Discuss 10, 2013, 19969-20003. View Article
[37] S.J. Kohler, I. Buffam, H. Laudon, K.H. Bishop "Climate's control of intra-annual and interannual variability of total organic carbon concentrations and flux in two contrasting boreal landscape elements" Journal of Geophysical Research 113(G3), 2008, View Article
[38] N. Dov "Man, a Geomorphological Agent: An Introduction to Anthropic Geomorphology" Springer, pp. 121–122, 1983. View eBook