International Journal of Environmental Pollution and Remediation (IJEPR)
ISSN: 1929-2732

Volume 2 - Year 2014 - Pages 1-12
DOI: 10.11159/ijepr.2014.001
Development and Validation of Noise Maps for the Container Terminals at the Port of Long Beach
I-Hung Khoo, Tang-Hung Nguyen
National Center of Green Technology & Education, College of Engineering,
California State University Long Beach,
1250 Bellflower Blvd, Long Beach, CA 90840, USA
i-hung.khoo@csulb.edu
Abstract - Noise emissions from various transportation modes including seaports have become a major concern to environmental and governmental agencies in recent years due to the impact they have on the community. The Los Angeles-Long Beach port complex is the nation's largest ocean freight hub and its busiest container port complex. As the container sector has the highest growth potential, the levels of noise generated by container traffic and handling activities may present a problem. The purpose of this study is to model the noise of container terminals at the port of Long Beach with the following specific objectives: (1) to determine, using noise mapping, the level of noise generated by the cargo handling and transport activities at the container terminals. A noise model of the port and its surroundings will be created, and validated with field measurements; (2) to assess the noise impact and identify the key noise source in the area; (3) to determine, through field measurements, the noise and activity variations during the period of study. The noise model will be a very valuable tool for the city and port authorities in making planning decisions and to predict future noise impact on the port and its surroundings.
Keywords: Noise mapping, transportation noise, container terminals, seaport.
© Copyright 2014 Authors - This is an Open Access article published under the Creative Commons Attribution License terms. Unrestricted use, distribution, and reproduction in any medium are permitted, provided the original work is properly cited.
Date Received: 2013-07-22
Date Accepted: 2013-12-05
Date Published: 2014-01-27
1. Introduction
Noise is a prevalent pollutant that affects all aspects of life around the globe. Noise can affect health, interrupt activities, and disrupt normal cognitive process [17, 24]. During the past few decades, the mobility of people and goods has increased, and with it the amount of traffic and the environmental noise [1]. So noise emissions from various transportation modes including seaports have become a major concern to environmental and governmental agencies. The European Union leads the rest of the world in recognizing the negative impact of environmental noise and issuing legislature to assess and reduce the noise [5]. As a result of EU directive 2002/49/EC, noise studies have been done at major European cities such as Paris, Brussels, Ireland, and Bologna [9, 16] as well as major seaports such as Hamburg, Copenhagen, and Livorno [15]. Noise studies have also been done at Asian cities such as Chojun, Korea and Tainan, Taiwan [13, 25]. These studies utilize the modern technique of noise mapping to analyze the noise distribution. The United States lags behind the European countries in terms of noise mapping. Currently community noise mapping is not mandated by the U.S. federal or state governments [10] and noise studies in the U.S. are limited to highway and airport noise. The noise prediction models used in these studies are limited in scope and do not include noise from sources other than the infrastructure under study. For example, the Traffic Noise Model (TNM) provided by the Federal Highway Administration (FHWA) can only model traffic noise and not rail or industrial noise [8]. In addition, there is no known noise mapping study of major US seaports. The Los Angeles-Long Beach port complex is the nation's largest ocean freight hub and its busiest container port complex. The combined Ports have had a constant rate of growth every year which exceeded that of the national average and they are designated as an Inter-modal Corridor of Economic Significance [14]. So there is a need for an appropriate noise study to ensure that the noise levels in the port and the surrounding areas do not exceed a reasonable level. This paper is intended to describe a study of the noise from the container related activities at the port of Long Beach by creating a noise model and noise maps of the port. The container terminals were selected as the target of this study due to the fact that 82% of all cargo handling equipment operated at the Port are used at container terminals. The noise map approach used in this study has several advantages over the past noise studies conducted at the Port of Long Beach which were limited to the monitoring of noise levels at a few selected locations or as part of the environmental impact statements [21]. One key advantage is that the noise map approach provides a geographical view of the noise distribution in and around the port areas; this can help the port authorities assess the noise situation in the port and the surroundings. The noise maps can also be used to evaluate the noise impact and identify the key noise source. The results of this study also give an insight into the relative contribution of different types of sources (such as truck traffic, rail traffic and industrial noise) to the overall noise.
As part of the study, field noise and activity data were also collected at different locations around the port near the container terminals. The data were compiled into charts which provide detail insights into the noise and activity variations by hour, day of the week, and month at the different locations. The noise charts are used to supplement the noise maps which show only the annual average values and not the variations. Using the charts, the noise and activity peaks can be identified.
2. Research Methodology
To understand the noise distribution and its impact, the modern approach of noise modeling and mapping is commonly used [2, 13, 23]. Noise mapping is the geographic presentation, via a map, of data related to outdoor sound levels and sound exposure. It takes into account the contribution of all noise sources as well as the effects of obstacles and terrain. Its focus is on the long-term averaged noise and not sporadic intermittent noise. The production of noise maps can be broadly divided into the following steps:
1) Create digital models of the buildings, screens, and topography.
- The ground topography (ground contours and buildings) must be accurately provided since sound propagation is strongly affected by the ground contours and obstacles between sources and receivers.
2) Collect the source power level and characteristics of all noise sources. These can be measured under normal working conditions, or obtained from the manufacturer or noise database. When quantifying the noise level, the unit of dBA is used. This represents the sound level in decibel with an A-weighted filter applied, which correlates well with subjective reactions to noise.
The operation of container terminals involves the following principal noise sources which are the focus of this study:
- Grantry cranes: The gantry cranes are used to load and unload containers from the ships. They are equipped with a large electric motor, located at high level, to lift the container up and down.
- Ship generators: The ship generators are large diesel generators that are used to produce the power required for onboard activities when ships are at berth.
- Trucks and trains: These are the two main methods of transporting containers to and from the container terminals.
- RTG cranes: The RTG crane is a mobile crane, equipped with a diesel motor, used for stacking containers within the container yard.
- Forklifts and yard tractors: These are used for moving the containers around the container yard.
Note that there are other sources of noise at the port such as warning sirens on cranes, ship's horns sounded on departure, train crossing warning bells, as well as the impact of containers on other surfaces. The noise levels resulting from these sources, although of concern to residents, do not have much effect on measured average noise levels due to their short duration and intermittent operation and are not included in this study.
3) Collect the operational information of all the noise sources at the port. The information required include the number of each type of noise source that is in operation, their locations, and the period of time that they are active.
4) Calculate the noise levels using noise propagation models to create the noise contours. In this study, the RLS-90, Schall-03, and ISO 9613-2 standards are used for calculating the road, rail, and industrial noise propagation respectively. Because noise levels can vary significantly over a short period, they are usually described in terms of an average level that has the same acoustical energy as the average of all the time-varying events. This energy-equivalent sound/noise descriptor is called Leq. A common averaging period is hourly, but Leq can also describe any arbitrary duration. The hourly Leq is denoted as dBA Leq(h).
5) Verifying the noise model using field measurements.
The following is the detailed discussion on the steps involved in developing the noise model of the Port.
2.1. The Spatial and Geographical Information for the Port
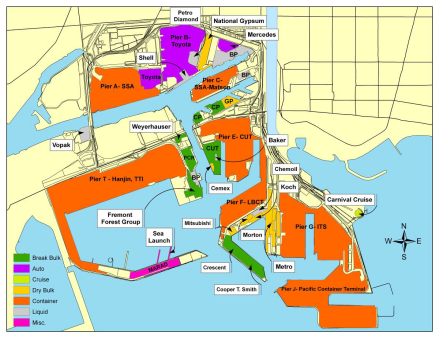
There are altogether 7 container terminals at the Port of Long Beach spread around different piers (Figure 1):
- Pier A: SSA
- Pier C: SSA
- Pier E: California United Terminals
- Pier F: Long Beach Container Terminal
- Pier G: International Transportation Service
- Pier J: Pacific Container Terminals
- Pier T: Total Terminals International
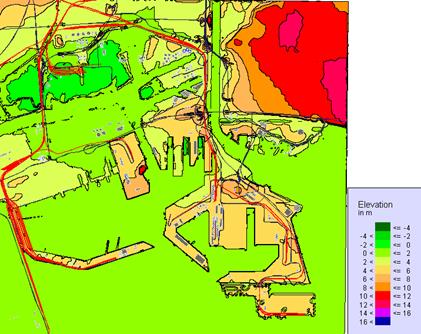
In this study, the ground topography was obtained from the USGS digital elevation model. The 1/3-arc second National Elevation Dataset (NED) was used, which has a resolution of approximately 10 meters. The current NED, however, still does not include the elevation of the recent extension to Pier J. So this data needs to be digitized manually.
Next, the features of the port such as roads, rails, buildings were digitized manually using the high resolution 0.6m orthoimagery of the entire port from the USGS. During the digitization process, Google, Bing, and AAA maps were used to identify the names of the roads so that they can be input into the computer model as well. Finally, the heights of the buildings and major structures at the port were entered into the computer model. These were obtained from Google Earth and through field observation.
The complete digitized spatial model of the Port with elevation contour is shown in Figure 2. The upper boundary of model is slightly north of Anaheim St. The left boundary is the edge between the Port of Long Beach and the Port of Los Angeles. The right boundary is the Los Angeles River, although some of the roads and buildings around the Long Beach Marina were included. Note that the roads and buildings around downtown Long Beach were not digitized since the container activities do not extend to that area. The area however is included in the noise propagation simulation.
2.2. Field Data Collection
The data collected in the field include the average noise level (Leq) and activity information for the trucks, trains, and cargo handling equipment. The annual average value of the measured noise will be used in validating the noise map results. The activity data is needed for compiling the operational information of the noise sources, which will be explained in detail next. The data were also compiled to provide the hourly, daily, and monthly averages. As the noise maps only show the annual average noise, the hourly, daily and monthly noise averages will be useful in understanding the noise variations.
For collecting the field data, representative locations were selected around the Port. Due to restrictions from the terminal operators of the Port, it was not permitted to take the measurements inside the container terminals. So, eight measurement locations were selected outside the terminals but close enough to the various key noise sources such as the trucks, cargo handling equipment, and trains. These eight locations are shown on the map in Figure 3. They include truck entrances, areas next to the container yards where container handling activities occur, and also the railroads. The locations are spread around the Port in order to give a reasonable sampling of the noise level.
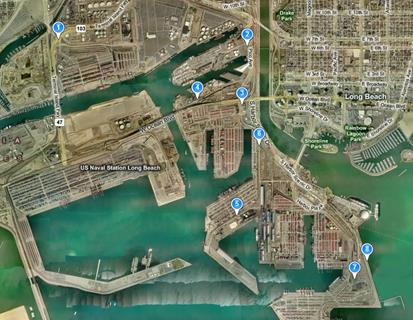
The noise and activity data were collected from November 2009 to June 2010. This timeframe covers the peak container activity period around November, as well as the slower periods thereafter; hence, the variations can be studied. The field data was collected for 4 to 6 hours each day during weekdays. Some data were also collected during the weekends. Due to limited number of research personnel, in order to get a good sampling, the research assistant moved around the different locations and took readings of 20-30 minutes each. The measurements were done during daylight hours between 8am to 4pm with a focus on the peak hours around 8am and 1pm where the activity is the highest.
2.3. Compiling the Sound and Operational Information of the Noise Sources
The volume of noise generated by the container activities is determined by the quantity of each noise source and their noise power and characteristics. The contribution of the noise source to the overall noise distribution then depends on the location of the source and their movement pattern plus the surroundings. So, the noise characteristics and the operational information of the sources need to be obtained and input into the noise model. The noise sources in the port areas can be broadly grouped into two major categories: industrial activities and traffic related activities [18]. The data needed for modeling industrial noise sources include:
- Sound power level and characteristics of every relevant industrial source such as ship generators, cranes, forklifts, yard tractors, etc.
- The number of each source, their location and movements.
- Operating hours of every source for each time period (day, evening, night)
The data required for modeling traffic related noise sources are the following:
- Road traffic data: the type of vehicles (light, medium, heavy, trucks, passenger cars), their number per hour for each time period (day, evening, night), and their average speed.
- Train traffic data: the type of train (cargo, passenger, etc), their number per hour for each time period (day, evening, night), their average speed.
- Location of roads.
- Location of rail tracks.
The sound power level and characteristics for the industrial sources can be obtained by direct sound measurements or by using values from available noise source databases. In this study, due to field access restriction, the noise database SourceDB is used. For the traffic related noise sources, the noise characteristics are already built into the calculation standards.
The remaining operational information such as the number of noise sources, their location and working hours are derived from the field data and data from the port authority [19, 20]. One useful information available from the Port is the air emission study that is conducted annually. The Air Emission Inventory Report contains details of the equipment and vehicles used at the port and their operational information. The Port uses the operational information of the equipment and vehicles to calculate the pollutants emitted; this information can be used for our noise study as well. This information together with the field activity data collected were used in the noise model. Below are the discussions on modeling the noise emissions from trucks, trains, ships, and cargo handling equipment.
Trucks
For the trucks and trains, the calculation standards have built-in assumption on the noise emission characteristics of the vehicles, so only the operational information is required.
The RLS-90 standard is used to calculate the noise from the truck traffic. The standard allows the simulation of road noise by modeling standard vehicle types such as cars and trucks. In this study, we are focusing on the container activities where only trucks are involved in the movements of containers on the road. So cars are excluded in the calculation. The parameters required for the model include the number of trucks per hour and their speed for each road segment used by the trucks in transporting containers in and out of the port. The Emission Report contains the average truck numbers for each of the major roads for different period of the day, including evenings and nights. These are adjusted using the actual truck data collected at the gates. The resulting number of trucks for each pier for different time period is shown in Table 1.
The truck routes are obtained from the field and the data is then compiled for each road segment and entered into the model. The speed of the trucks is obtained from both field estimation and the air emission report.
Table 1. Average number of trucks by time period for each pier (derived from field data and Air Emission Report).
|
Pier |
AM (6-9am) |
MD (9am-3pm) |
PM (3-7pm) |
NT (7pm-6am) |
|
A |
237 |
1528 |
663 |
717 |
|
C |
161 |
873 |
407 |
557 |
|
E |
600 |
2183 |
858 |
884 |
|
F |
406 |
1542 |
672 |
514 |
|
G |
374 |
2321 |
975 |
938 |
|
J |
163 |
1023 |
435 |
451 |
|
T |
326 |
1897 |
744 |
514 |
Trains
The Schall-03 standard is used to calculate the noise from the train activities. The information needed for the calculations are the number of trains per day, the length of the train, and the speed. The standard also takes into account the different noise level for different types of trains such as express, freight, commuter trains etc. Freight train is selected for this calculation. The average number of trains per day carrying containers and the average length of the trains are obtained from the Air Emission Report. The number however is for the twin ports of LA and Long Beach. So, the average container volume for each port is used to divide the train numbers between the two ports. Next, the trains are distributed among the different container terminals depending on their cargo volume. The truck count recorded in the field for each pier, which is a good estimate of the cargo volume, is used for this purpose. Table 2 shows the data for the train activities. (Note that Pier C and E do not have rail activities). The information is entered for each rail segments serving the different terminals. The average speed of the trains is assumed to be 20mph based on field estimation.
It is to be noted that the standard requires the number of trains to be an integer value. So the number is rounded to the nearest integer and the length of the train is adjusted proportionally so that the noise effect remains the same.
Table 2. Average number of trains per day & average number of container ships active per hour for each pier (derived from Emission Report and truck data).
|
Pier |
Average # of trains per day |
Average length of train (meters) |
# of container ships active per hour |
|
A |
3 |
1744 |
1.24 |
|
C |
- |
- |
0.67 |
|
E |
- |
- |
1.74 |
|
F |
3 |
1760 |
1.16 |
|
G |
3 |
2648 |
1.44 |
|
J |
2 |
1751 |
0.83 |
|
T |
3 |
2165 |
1.48 |
Ships and Cargo Handling Equipment
The ISO 9613-2 standard is used for calculating the noise from the ships and the cargo handling equipment. Since it is a general standard, the noise power and spectrum of the source and its operational information need to be provided. In this study, due to restrictions, it was not possible to measure the noise characteristics of these sources in the field. So, the noise database, SourceDB, is used instead. SourceDB is an industrial noise database which contains the noise characteristics of approximately 1,100 sources in over 70 different industries including those needed for our study. The database was developed for the EU IMAGINE (Improved Methods for the Assessment of the Generic Impact of Noise in the Environment) project and has been used in the EU NoMEPorts (Noise Management in European Ports) noise mapping activity which is similar to our project. The sound characteristics are available for all the sources needed in this study: ships, dockside cranes, RTG cranes, forklifts/sidepicks/top-handlers, yard tractors. The sound spectrum of the equipment is specified in 1/3 octave band from 25Hz to 10kHz. To reduce the calculation time, the forklifts/sidepicks/top-handlers were grouped together due to their similarity. Because of access restrictions, the activities for the ships and cargo handling equipment could only be recorded for a few of the piers and the data covered only a part of the overall activities. So, instead the operational information for these sources was derived from the air emission report and then adjusted using the field data.
For the container ships, the emission report lists the total number at berth for the entire port. This number is scaled to the current year's level using the cargo volume statistics and then distributed among the terminals based on the cargo volume of each pier using the observed truck activities as indicator. The emission report also indicates the average time at berth. Multiplying this with the number of ships will give the total hours of operation for the ships. This is then converted to the number of ships active per hour at each pier. The data is shown in Table 2. It can be seen that the number of container ships at berth per hour at each pier is less than 2, which is within the capacity of the piers. On average, 1.4 dockside cranes are needed to load/unload each ship. So the ship data is multiplied by 1.4 to get the number of dockside cranes active per hour at each pier.
The air emission report also lists the make and model of each piece of cargo handling equipment (forklift, RTG crane, side-pick, top handler, yard tractor) in use at each terminal, and their annual hours of operation. Once again, the values are scaled to the current year's level using the cargo volume statistics and then adjusted for each pier using the observed truck activities as indicator for the cargo volume. The final values are shown in Table 3 as the number of equipment active per hour for each pier for different time period. The same time distribution from the truck data is used here to divide the activities into the different time periods.
To complete the calculation, the locations of the sources need to be specified. Line sources are used to represent the ships and the cargo handling equipment. The location of the ships, dockside cranes, and some yard tractors will be next to the berth. The forklifts, RTG cranes, and yard tractors will be located in the container yard; several line sources are needed depending on the number of rows of containers in the yard.
|
RTG Cranes |
||||
|
Pier |
AM (6-9am) |
MD (9am-3pm) |
PM (3-7pm) |
NT (7pm-6am) |
|
A |
2.1 |
6.8 |
4.5 |
1.9 |
|
C |
0 |
0 |
0 |
0 |
|
E |
2.7 |
8.8 |
5.9 |
2.4 |
|
F |
1.3 |
4.2 |
2.8 |
1.1 |
|
G |
2.0 |
6.5 |
4.4 |
1.8 |
|
J |
0.7 |
2.1 |
1.4 |
0.6 |
|
T |
1.9 |
6.1 |
4.1 |
1.7 |
|
Forklifts/side-picks/top-handlers |
||||
|
Pier |
AM (6-9am) |
MD (9am-3pm) |
PM (3-7pm) |
NT (7pm-6am) |
|
A |
3.6 |
11.7 |
7.8 |
3.2 |
|
C |
1.5 |
4.7 |
3.1 |
1.3 |
|
E |
1.9 |
6.1 |
4.1 |
1.7 |
|
F |
1.3 |
4.3 |
2.9 |
1.2 |
|
G |
3.2 |
10.3 |
6.9 |
2.8 |
|
J |
3.0 |
9.8 |
6.5 |
2.7 |
|
T |
1.9 |
6.0 |
4.0 |
1.6 |
|
Yard tractors |
||||
|
Pier |
AM (6-9am) |
MD (9am-3pm) |
PM (3-7pm) |
NT (7pm-6am) |
|
A |
15.9 |
51.2 |
34.0 |
14.0 |
|
C |
5.0 |
16.1 |
10.7 |
4.4 |
|
E |
10.0 |
32.1 |
21.4 |
8.8 |
|
F |
7.6 |
24.2 |
16.1 |
6.6 |
|
G |
14.8 |
47.6 |
31.6 |
13 |
|
J |
9.5 |
30.4 |
20.2 |
8.3 |
|
T |
16.0 |
51.3 |
34.1 |
14.0 |
3. Noise Maps for the Port of Long Beach
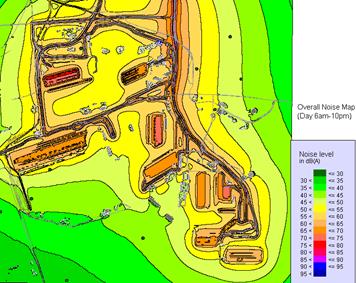
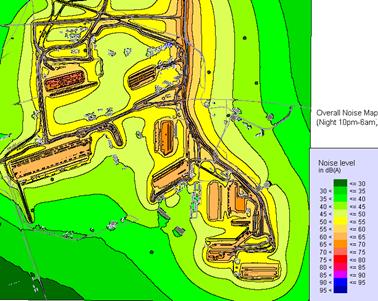
With the spatial information of the port and the operational information of the noise sources, the noise model is created using the noise modeling software SoundPLAN from Braunstein & Berndt. The software then calculates the noise over the area of interest using the appropriate noise propagation standards to produce the noise maps. A noise receiver grid spacing of 10 meters was used in the calculation. The overall noise maps of the Port are shown in Figure 4 and Figure 5 respectively for the day period (6am-10pm) and night period (10pm-6am). These time periods are defined as per the RLS90 and Schall03 calculation standards. The noise values displayed on the noise maps correspond to the annual average values. From the noise maps, it can be observed that the highest noise is concentrated along the 710 freeway and the major roads. The container yards also have significant noise.
4. Validation of the Noise Model
It is very important when creating the noise model to ensure the reliability and accuracy of the input data such as the noise characteristics of the sources and their operational information. Inaccuracies in the data would result in errors in the noise maps which could have far reaching consequences such as incorrect action plans. In this study, the validation is done by comparing the daytime noise map (Figure 4) with actual field measurements at selected location throughout the Port (as described in section 2.2). It can be assumed that if the daytime noise map is accurate, the night time result is accurate as well since it is generated from the same noise model. The comparison is shown in Table 4. The average difference between the predicted and measured noise for all 8 locations is -2.85 dB with a standard deviation of 3.59 dB.
Table 4. Comparison of noise map values with actual field measurements.
|
Location |
Noise level from noise map (dB) (1) |
Average noise level measured in the field (dB) (2) |
Difference (dB) = (1) – (2) |
|
1 |
67.2 |
71.6 |
-4.4 |
|
2 |
67.3 |
70.9 |
-3.6 |
|
3 |
62.5 |
72.8 |
-10.3 |
|
4 |
72.6 |
71.8 |
+0.8 |
|
5 |
67.2 |
68.8 |
-1.6 |
|
6 |
62.5 |
65.9 |
-3.4 |
|
7 |
64.9 |
66.1 |
-1.2 |
|
8 |
66.7 |
65.8 |
+0.9 |
Following the procedure outlined in the Good Practice Guide published by the European Commission WG-AEN [7], it is estimated that the uncertainty in the vehicle speed would result in an error of up to 3dB in the calculated noise map results. Additionally, because short term measurements were used to determine the long-term noise levels, an error up to 2dB is expected in the extrapolated measurement values [22]. So, a total error of 5dB is possible in the difference between the noise map value and the measured noise value. Thus, the calculated mean difference of -2.85 dB is well within this expected range.
Looking at the results in Table 4, it can be seen that all the errors are reasonably low except for Location 3. Location 3 is 100 meters south of a truck entrance. The trucks come in from the north and enter the terminal without passing by location 3. So in the noise simulation, the location is not next to any activity. However, the field measurement is picking up the noise from the non-container traffic traveling on the road next to the observation location. This explains why the field noise measurement is so much higher than that predicted by the noise map. This location should not be used for validating the noise map result. Without location 3, the average difference between the predicted and measured noise is -1.78dB with a standard deviation of 2.12dB.
In conclusion, the noise model is reasonably accurate. For validating the results, it is very important to use measurements at locations close to the container related activities and away from any non-container activities that are not included in the noise map simulation.
5. Evaluation of Noise Impact using Noise Maps
The noise maps can be used to evaluate the noise impact of the port container activities on high priority or sensitive areas. Since the Port is located in a predominantly industrial area, there are few sensitive areas in its immediate vicinity. The closest ones are the non-industrial areas across the river, to the east of the Port, and the Queen Mary Hotel next to the cruise terminal. It is to be noted that there is no specific guidelines or regulations on port noise in the United States. The Long Beach Municipal code (Section 8.80) specifies the noise standards for various districts but allows the limit to be raised if the ambient noise already exceeds the existing limits. So it is not suitable for our study. Instead, the Community Noise Exposure guidelines of the Los Angeles City municipal code, the assessment method of the adjacent Port of Los Angeles, will be used here to assess the noise impact [4].
- The area to the east of the LA River is the closest non industrial area to the port. Due to its distance from the Port, the noise level is low as indicated on the noise map in Figure 4. The noise level for the area next to Cesar Chavez park on the eastern edge of the LA River do not exceed 60dB during the day period. This is within the Community Noise Exposure guidelines of the LA municipal code, which consider 50-70 dB to be normally acceptable for playgrounds and parks. During the night period, it is below 55dB. The noise drops steadily further east towards the city. Here the port activity noise will be insignificant compared to the urban city noise.
- The Queen Mary Hotel is situated on the Port next to the cruise terminal. The noise level at the location is well within acceptable limits. Its noise level is 55dB during the day period and 50 dB during the night period. The Community Noise Exposure guidelines of the LA municipal code consider 60-65 dB to be normally acceptable for multifamily homes.
6. Determination of the Most Significant Source
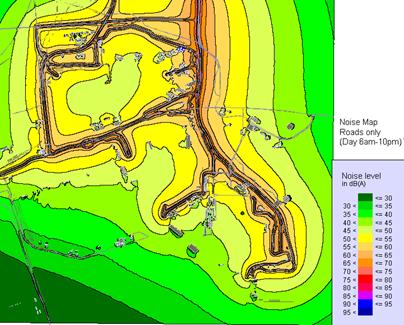
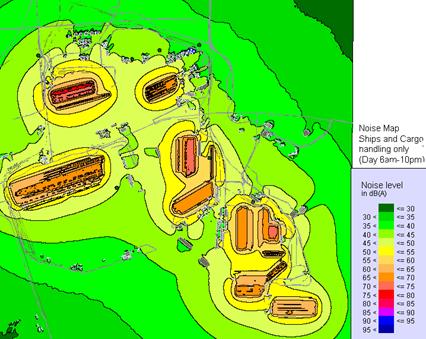
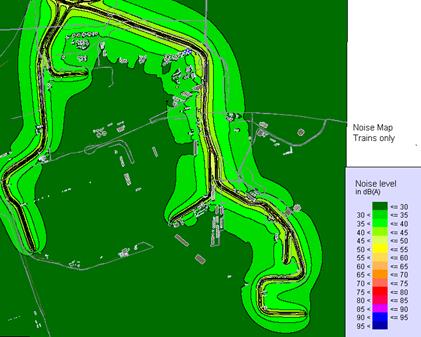
To analyze which source is dominant, the noise maps are generated for each type of source acting alone, i.e. truck activities only (Figures 6), ships and cargo handling activities only (Figures 7), and train activities only (Figures 8). From these noise maps, it is obvious that the truck movement activity is the highest source of noise, while train activity contributes the least to the overall noise. So if any noise mitigation is required, the focus should be on the truck activities.
The noise impact can also be assessed for each type of activity. The FHWA has standards and regulations related to traffic noise. These are identified as Noise Abatement Criteria (NAC) for a Type 1 federally funded highway improvement project. Although these standards are not directly applicable to this study since it is not a Type 1 funded highway improvement project, they are still useful for evaluating the noise impacts from the truck traffic. Looking at the noise map for the truck activities only, it can be seen that the noise is concentrated on the roads and radiates outwards. It can be observed from the noise map that the noise level is within the 71dB limit for developed land 50 feet away from the major roads (not counting the Freeway), following the Caltrans/FHWA Noise Abatement Criteria for Category C activities [3].
The noise from the cargo handling activities can also be evaluated using the LA municipal code for industrial equipment noise. The code stipulates a limit of 75dB 50 feet away. Using the noise map for the cargo handling activities, it can be observed that the noise is well within the limit, 50 feet away from container yards.
7. Analysis of the Noise and Activity Variations
The noise maps only display the annual average noise values. To help understand the noise variations, the field data can be used. As mentioned earlier, the noise and activity data were collected at 8 different locations around the Port (see Figure 3). The activity data include the truck, rail, crane, forklift, and yard tractor activities. The truck activity is quantified as the number of truck movements per hour. The rail activity is quantified as the fraction of the hour that the rail is active. The crane, forklift, yard tractor activities are quantified as the number of equipment that is active per hour. Note that the forklifts, side-picks, and top-handlers are grouped together as forklifts. The field data were compiled to provide the hourly, daily, and monthly averages for the noise levels and amount of activities for each location. The detailed analysis of the data is summarized below. A few of the key charts are also presented.
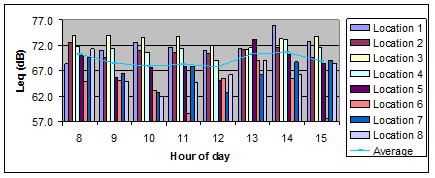
Hourly noise
- The average hourly noise measured at each location is shown in Figure 9. On average, the noise peaks around 8am (70.3dB) and tapers off after that to a minimum of 67.8dB around noon. It then peaks again around 1pm (70.3dB) and 2pm (70.4dB), and tapers off again after that. This is consistent with the operating characteristics of container terminals at the port.
- The highest noise is at Location 1 around 2pm (75.8dB) and lowest noise is at location 6 around 3pm (57.6dB). Location 6 experienced the largest variation throughout the day (11.6dB), while Locations 2 and 3 have the smaller variations, 2.9dB and 2.8dB respectively.
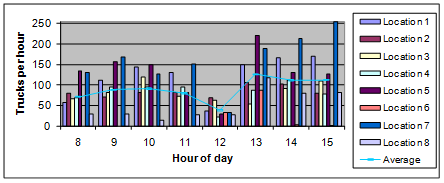
Hourly Truck Activities
- The average number of truck movements observed at each location per hour is shown in Figure 10. On average, the PM truck activity is higher than the AM truck activity. The peak truck activity is around 1pm. The lowest truck activity is around noon.
- Location 7 has the highest truck activity around 3pm, followed by Location 5 around 1pm. These are truck entrances.
Hourly Train Activities
- The rail is most active around 1pm at Location 1. Overall, Location 1 also has the most rail activities. This is consistent with the fact that Location 1 is at the beginning of the rail lines that serve most of the port.
Hourly Cargo Handling Activities
- Overall, the cargo handling activities are the highest around 9am and lowest around noon. The AM period has slightly more activities compared to the PM period.
- The highest crane and yard tractor activities are at Location 6, around 9am. The highest forklift activity is at Location 5, also around 9am.
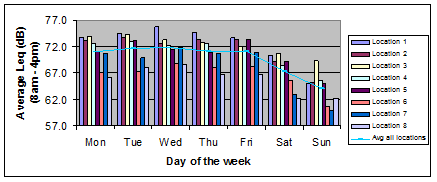
Daily Noise
- The average daily noise at each location is shown in Figure 11. On average, the noise is very much higher during the weekdays compared to the weekends. The noise peaks slightly on Wednesday (71.8dB), but varies only by 0.8dB throughout the weekdays. The lowest noise is on Sunday (64.1dB) where there is not much activity.
- The highest noise is at Location 1 on Wednesday (75.7dB) and the lowest noise on a weekday is at location 8 on Monday (66.2dB). Location 5 experienced the largest variation throughout the weekdays (2.6dB), while Location 2 has the smallest variations, 1dB.
Daily Truck Activities
- On average, the truck activities are much higher during the weekdays compared to the weekends. The highest truck activity is on Friday and the lowest activity is on Sunday.
- Location 7 on Friday has the highest truck activity.
Daily Train Activities
- The rail is most active on Thursday at Location 1. This is followed by Location 2 on Friday
Daily Cargo Handling Activities
- The cargo handling activities peak on Friday for the cranes and forklifts, and bottom out on Wednesday.
Monthly Noise (December to June)
- On average, the noise peaks in January (72.4dB) and drops off to a minimum in March (66.1dB) before rising steadily again.
- The highest noise is at Location 1 in January (76.9dB) and lowest noise is at location 7 in March (60.6dB). Location 5 experienced the largest variation throughout the months (12.6dB), while Location 3 has the smallest variation, 4.1dB.
Monthly Truck Activities
- Overall, the truck activity is highest in January and lowest in March.
- Location 7 has the highest truck activity in January and February. Next is Location 5 in January.
Monthly Train Activities
- The rail is most active in April for both Locations 1 and 2.
Monthly Cargo Handling Activities
- The crane and yard tractor activities peak in January.
- The forklift activities peak in January as well as in June.
8. Conclusion
The Port of Long Beach is one of the major nodes in the logistic chain and an important economic center in the region. As the container sector of the Port of Long Beach has the highest growth potential, the levels of noise generated by cargo transportation and handling activities are especially of interest. In this pilot study, the noise distribution at the container terminals at the Port was modeled by means of noise mapping. The noise maps generated present the noise distribution in and around the port areas and give an insight into the relative contribution of different groups of sources (e.g. road traffic, rail traffic and industrial noise). It was determined that the truck movements were the main contributor of container activities noise in the Port, followed by cargo handling, and then rail. The noise maps were also used to evaluate the noise impact on sensitive non-industrial areas near the port, as well as the relative impact of specific type of sources. It was found that the noise did not exceed the relevant guidelines. To supplement the noise maps, the field data collected in this study were compiled to provide the hourly, daily, monthly noise and activity variations. It was observed that the average noise was highest around 8am and 1pm and lowest around noon. The noise levels during the weekdays were also very much higher than the weekends. During the period of study (December – June), it was observed that the noise peaked in January and dropped off to a minimum in March before rising steadily again.
Noise mapping is a very valuable tool allowing port authorities not only to assess the current noise situation in the port, but also to examine the potential impact of future development plans. If noise abatement measures are recommended, the noise model can then simulate the new scenario to see if the desired reduction is achieved. All these will be part of the next phase of our research on port noise and the environment.
Acknowledgement
This work was funded by the California Department of Transportation through METRANS. The authors wish to thank the port authorities of the Port of Long Beach for their invaluable assistance in this research project. Special thanks to Mr. Rick Cameron, Director of Environmental Planning, Mr. Don Snyder, Director of Trade Relations, and Mr. Mitch Poryazov, Assistant Terminal Services Manager. Finally, the authors wish to acknowledge the efforts of student assistants Kiran Rajanna, Dane Christensen, Eduardo Delgado, Benjamin Solinsky.
References
[1] M. Baaj, M. El-Fadel,, S. Shazbak, & E. Saliby "Modeling noise at elevated highways in urban areas: a practical application", 2001, ASCE Journal of Urban Planning and Development, 169-180. View Article
[2] C. Bourbon, P. Noel, R. Mummenthey "Brussels Life Project: Noise Mapping As a Tool for Management and Planning Road Traffic Noise in Urban Area" 2001, Proceedings of the International Congress and Exhibition on Noise Control Engineering (INTERNOISE 2001). View Article
[3] Caltrans. "Traffic Noise Analysis Protocol for New Highway Construction and Reconstruction Projects", 2006. View Article
[4] City of Los Angeles "City of Los Angeles CEQA Thresholds Guide", 2006. View Article
[5] European Commission. (2002). "Directive 2002/49/EC of the European Parliament and of the council of 25 June 2002 relating to the assessment and management of environmental noise" Official Journal of the European Communities. View Article
[6] European Commission. "2003/613/EC Commission recommendations of 6 August 2003 concerning the guidelines on the revised interim computation methods for industrial noise, aircraft noise, road traffic noise and railway noise, and related emission data" 2003, Official Journal of the European Communities. View Article
[7] European Commission Working Group - Assessment of Exposure to Noise (WG-AEN) "Good practice guide for strategic noise mapping and the production of associated data on noise exposure" 2006. View Article
[8] Federal Highway Administration "Federal Highway Administration traffic noise model user's guide" version 2.5., 2004, Washington D.C. View Article
[9] M. Garai, & D. Fattori "Strategic Noise Mapping of the Agglomeration of Bologna, Italy" 2009, Urban Transport XV. Urban Transport and the Environment, 519-528. View Article
[10] K. Kaliski, E. Duncan, & C. James "Community and regional noise mapping in the United States" 2007, Sound and Vibration, 14-17. View Article
[11] I. Khoo, T. Nguyen "A Preliminary Study of Noise at the Port of Long Beach" 2011, METRANS National Urban Freight Conference (NUF). View Article
[12] I. Khoo, T. Nguyen "Developing a Noise Model for Container Terminals at the Port of Long Beach" 2011, Transportation Research Forum.
[13] J.H. Ko, S. I. Chang, B.C. Lee "Noise impact assessment by utilizing noise map and GIS: A case study in the city of Chungju, Republic of Korea" 2011, Applied Acoustics, 544-550. View Article
[14] J. Lea and J.T. Harvey "Data Mining of the Caltrans Pavement Management System (PMS) Database" 2004, Technical Report to California Department of Transportation, University of California at Berkeley, CA. View Article
[15] M. Morretta, A. Iacoponi, & F. Dolinich "The port of Livorno noise mapping experience" 2008, Journal of the Acoustical Society of America, 123(5), 3137. View Article
[16 ]E. Murphy, E. A. King, & H. J. Rice "Estimating human exposure to transport noise in central Dublin, Ireland", 2009 Environment International, 35(2), 298-302. View Article
[17] H. Niemann, C. Maschke "WHO report on noise effects and morbidity" 2004, World Health Organization. View Article
[18] Noise Management in European Ports "Good Practice Guide on Port Area Noise Mapping and Management" 2008. View Article
[19] Port of Long Beach "Port of Long Beach Air Emissions Inventory – 2005", 2005. View Article
[20] Port of Long Beach "Port of Long Beach Air Emissions Inventory – 2008", 2008. View Article
[21] Port of Long Beach "Middle Harbor Redevelopment Project Final EIS/EIR", 2009. View Article
[22] J. Romeu, M. Genesca, T. Pamies, S. Jimenez "Street categorization for the estimation of day levels using short-term measurements" 2011, Applied Acoustics,569-477. View Article
[23] H. Stapelfeldt, A. Jellyman "Noise Mapping in Large Urban Areas" 2001, Proceedings of the International Congress and Exhibition on Noise Control Engineering (INTERNOISE 2001). View Article
[24] C. Sust, & H. Lazarus "Signal perception during performance of an activity under the influence of noise" 2003, Noise and Health Journal, 6, 51-62. View Article
[25] K. T. Tsai, M. D. Lin, & Y. H. Chen "Noise mapping in urban environments: A Taiwan study", 2009 Applied Acoustics, 70(7), 964-972. View Article