International Journal of Environmental Pollution and Remediation (IJEPR)
ISSN: 1929-2732

Volume 1 - Year 2012 - Pages 90-97
DOI: 10.11159/ijepr.2012.013
Electricity Consumption and Possible Savings
Aslı Gül Öncel
Galatasaray University
Faculty of Economics and Administrative Sciences
Ortaköy, İstanbul, Turkey
aoncel@gsu.edu.tr
Abstract - Energy has always been critical for economic growth and social development. The need and use of energy is one of the major problems for all countries. The reserves in the ground are very limited while their use grows significantly every year. Given finite energy resources and continuously rising demand for industrial products, meeting industrial energy demand and minimizing its economic impact in the future will be a significant challenge. Because of the hard fact of energy scarcity, it is important to take preventive measures to reduce energy costs, and increase efficiencies in industry. The key factors of a sustainable energy politics are promoting growing energy efficiency, ensuring the diversity of energy technology and adding renewable sources to the energy supply system. Energy efficiency implementation in the production may lead enterprises to be a part of sustainable development and also save millions of dollars. Energy efficiency problems have many aspects. One of the most important of the problems is lost and leaking electricity, which has an immense negative effect on energy efficiency. In the present study we mainly focus on electricity consumption and possible savings. We begin by an overview of the World's energy production and consumption as well as Turkey's energy production and consumption. In the next part, we contextualize this by discussing the relationship between the energy and the environment. We secondly realize a SWOT analysis to show the strengths, weaknesses, opportunities and threats of Turkey's energy politics from an environmental point of view. We contextualize this by discussing a global overview of electricity sector in the world and in Turkey. The more discussion focuses on Turkish Industrial energy consumption and the amount of possible annual savings in the Turkish industrial sector.
Keywords: Electricity Sector, Energy Efficiency, Sustainable Development, Energy Consumption
© Copyright 2012 Authors - This is an Open Access article published under the Creative Commons Attribution License terms. Unrestricted use, distribution, and reproduction in any medium are permitted, provided the original work is properly cited.
1. Introduction
For many countries in our world, energy is a major problem, the main reason being the ever increasing demand due to the industrialization of the largest countries. The major source of energy for industrial production, residential consumption, and transportation are fossil, oil and coal. The reserves in the ground are very limited while their use grows significantly every year. In addition to this scarcity problem, the burning of fossil fuels releases all manner of pollutants into the air with dangerous effects on human health, and greenhouse gases which threaten the environment. The main negative impact of the combustion of fossil fuel are air pollution and climate change, along with the major harm coming from the extraction and transport of this kind of this energy source. There is widespread consensus that energy policy plays a vital role in potentially mitigating the impacts of global warming and crisis of energy availability. With the increasing negative effects of narrow dependence on fossil fuels, on the environment and further depletion of a finite supply, many countries have been forced to inquire into more environmentally friendly energy alternatives.
A country's level of development in terms of energy can be monitored by two key indicators that are (i) energy consumption per capita, (ii) energy efficiency. Energy efficiency is the reduction of energy consumed per unit of service or product, without causing a reduction in living standards and service. High energy consumption per capita in a country indicates the vitality and prosperity of economic activity. Low energy density in a country signifies it is producing more service or product with the same amount of energy. In this case, the optimal condition of a developed country is high energy consumption and low energy density.
In this study, we start by giving a global overview of the World's energy production and consumption and Turkey's energy production and consumption. We contextualize this by discussing the relationship between the energy and the environment. A SWOT analysis is realized to show the strengths, weaknesses, opportunities and threats of Turkey's energy politics from an environmental point of view. the World's electricity production and Turkey's electricity production are given in the 5th and 6th section.. In the 7th section we give data about Turkish industrial electricity consumption and in the next section, we proceed to investigate Turkish Industrial electricity usage and the amount of possible annual savings. Finally, we summarize the main conclusions.
2. World Energy Production and Consumption
Overall, in 2009 world primary energy consumption including oil, natural gas, coal, nuclear and hydro power, fell by 1.1%, the first decline since 1982 (Web-1). While oil, natural gas and nuclear power consumption declined, coal consumption was essentially flat, and only use of hydroelectric output and other renewable forms of energy increased. Consumption in OECD countries was comparatively lower, falling by 5%, the largest annual decline on record; OECD consumption retreated to its lowest level since 1998. This pattern of a decline in energy consumption was evident in all regions apart from the Asia Pacific and Middle East; notably, energy consumption in China accelerated to 8.7%, which included an increase in hydroelectric power generation of 1.5%.
Oil remains the world's largest energy source, given its importance in the transportation and industrial end-use sectors. Yet in 2009 global oil production fell by 2.6%: production in 2008 was on average 81995 KBPD and in 2009 slightly less at 79948 KBPD. In 2008 global petroleum products consumption fell by 1.1%, and in 2009 experienced the largest decline since 1982. The total consumption of petroleum products was 85,268 in 2008, which decreased in 2009 to 84,255 (Web-2).
Global gas production has declined for the first time on record. In 2008, natural gas production was 3060.8 billion cubic meters (Web-3).This production fell by 2.1% in 2009, to 2987.0 billion cubic meters. Globally, natural gas was the fuel that experienced the most rapid decline in consumption, falling by 2.1%, the largest decline on record in 2008, 3010.8 billion cubic meters and in 2009 2940.4 billion cubic meters. Since 2008, it has declined 2.1%.
Global coal production in 2009 rose 2.4%, from 336.9 Mtoe in 2008 to 348.6 in 2009. Global coal consumption was flat in 2009, the weakest annual change since 1999. In 2008 total global coal consumption was 132.4 (quadrillion Btu), and in 2009 fell in all regions except the Asia-Pacific and Middle East.
Global nuclear output dropped by 1.3%, a third consecutive global decline. We see that nuclear energy consumption in 2008 was 620.2 and 610.5 in 2009.
Although other forms of renewable energy remain a small share of the global energy mix, they have continued to grow rapidly. In 2008, total non-hydro renewable electricity net generation -- geothermal, wind, solar, tide and wave, biomass and waste -- was 5.933 quadrillion Btu, and hydroelectricity net generation was 30.735 quadrillion Btu. Total biofuels production was 1,489.723 KBPD. Hydroelectric generation grew by a below-average 1.5%, which nonetheless was sufficient to make hydro the world's fastest growing major fuel in 2009. Growth in its use was led by China, Brazil and the US.
The total non-hydro renewable electricity net consumption - geothermal, wind, solar, tide and wave, biomass and waste was 6.049 (quadrillion Btu), hydroelectric electricity net consumption was 30.735 (quadrillion Btu), total biofuels consumption is 1,359.3 KBPD. Continued government support, including targeted fiscal stimulus in many countries, helped to boost global wind and solar generation capacity by 31% and 47%, respectively. Wind growth was led by China and the US, which accounted for a combined 62.4% of total growth (Web-1).
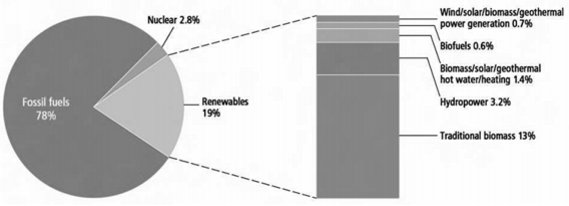
Renewable energy supplies 19% of global final energy consumption, counting traditional biomass, large hydropower, and "new" renewables (small hydro, modern biomass, wind, solar, geothermal, and biofuels) (See Figure 1) (Web-4) of this 19%, traditional biomass, used primarily for cooking and heating, accounts for approximately 13% and is generally growing slowly. However, in some regions its aggregate use is declining where it is progressively being used more efficiently or in many cases totally replaced by more modern energy forms. Hydropower represents 3.2% and is growing modestly, but from a large concentrated base. The other renewables account for 2.6% but are growing very rapidly in developed countries and in some developing countries.
Global renewable energy capacity grew at rates of 10 to 60 percent annually for many technologies during the five year period from late 2004 to 2009 (Web-5). For many renewable technologies, such as wind power, growth accelerated in 2009 alone as much as it did in the previous four years. More wind power capacity became available in 2009 than any other renewable technology's capacity. The grid connecting solar photovoltaic devices increased the fastest of all renewables technologies, with a 60% annual average growth rate for this five-year period. Biofuels also grew rapidly. Other technologies including hydropower, biomass power and heat, and geothermal power were continued growing at more ordinary rates of 3 to 6 percent, making them comparable with global growth rates for fossil fuels.
3. Turkey Energy Production and Consumption
The quality of effective use of energy sources plays a vital role in the economic growth and development of a country. Energy has always been critical for economic growth and social development. Turkey is in a harmonization period with European Union and has been the subject of numerous energy studies. A focal issue of course is Turkey's unique geographical situation, spaning two different continents - Europe and Asia.
With improved macro- economic conditions the demand for energy is increasing. The Turkish Ministry of Energy and Natural Resources (MENR) prepares energy generation and demand plans in accordance with growth targets given by the State Planning Organization (SPO, 2009). SPO has been reorganized as the Ministry of Development in June 2011 with Decree Law No. 641.
In this project, we see that Turkey's principal energy policy is based on the following items (Web-4):
- - Taking into account consumers accessibility to energy in terms of cost and time,
- - Meeting long term demand using public, private and foreign capital,
- - Diversifying energy supplies (no dependence on a single source or country),
- - Increasing energy efficiency in the regional and global field,
- - Ensure the diversity of energy technology,
- - Adding renewable sources to the energy supply system,
- - Implementing measures for energy efficiency,
- - Protecting the environment and public health in the production of energy.
Turkey unlike many countries has a full range of diversified fossil and nuclear resources - coal, oil, natural gas and nuclear energy resources as shown by Ocak et al.(2004). Coal is most important, accounting for 43% of Turkish primary energy production; its lignite reserves play a critical role. Oil provides around 40% of Turkey's total energy requirements, and its mostly imported as there are only limited domestic oil reserves. Turkey is highly dependent on imported natural gas and it is playing an increasing role as a primary energy supply.
There is currently no nuclear power plant in Turkey. On the other hand, construction of a nuclear power plant with total capacity of 2,000 MW is projected by the year 2016. It is expected that by 2020 Turkey will experience a deep discrepancy between its primary energy production of 85 Mtoe/year and its primary energy consumption of 318 Mtoe/year. Given an evaluation of its estimated fossil fuel reserves, which total 2454 Mtoe/year, it is expected that Turkey will be forced to import an increasing proportion of its energy in coming decades. However, it is also the case that Turkey in fact has the potential for 122.3 TWh/year of hydropower, 1.8 Mtoe/year of geothermal power, 50 TWh/year of wind power and 32 Mtoe/year of biomass energy, in usable and/or economic quantities as shown by Kaygusuz (2002).
The average hydroelectric capacity in Turkey is 45 TWh/year, while the technical wind potential is given as 88,000 GW and the economic potential is estimated as 10,000 MW. In the case of geothermal power plants, they exist in nineteen countries, and new plants continue to be commissioned annually in Turkey. Since 2004, Turkey has achieved a significant 200%increase of electric capacity. The biomass potential of Turkey is estimated at potentially a gross of 150 Mtoe/year as shown by Rowe et al. (1994). Finally, with reference to solar energy usage for heating systems MENR projections estimate it will be 745,000 toe annually by 2020. For all these reasons, it is not surprising that Turkey attaches considerable importance to renewable energies.
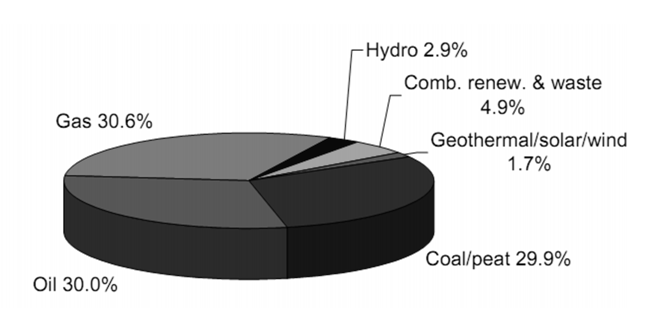
Turkey's primary energy supply in 2000 was 81.3 Mtoe. According to projections, energy demand should reach 126.3 Mtoe by 2010, and grow to 282.2 Mtoe by the year 2020. In the Figure 2 we also see the distribution of total primary supply in 2008 is 30.0% oil, 30.6% gas, 2.9% hydro, 29.9% coal/peat, 1.7% geothermal/solar/wind and finally 4.9% renewable and waste energy.
In case of the supply and demand energy of Turkey, if we look at the projection of energy plans by MENR (table 1) we notice from reading the high demand scenario that current per capita energy consumption is far below the world average, and lower than the other European countries' consumption. On the other hand, it is anticipated that in 2020 per capita consumption in Turkey (5,781 kWh) will just reach the level of the present consumption of today's developed countries (Web-6)
Table 1. Projection of energy plans by MENR.
|
Year |
|||||||||
|
Data |
2000 |
2003 |
2005 |
2007 |
2010 |
2013 |
2016 |
2020 |
|
|
Population(106) |
67.4 |
70.7 |
72.8 |
74.9 |
77.9 |
80.6 |
82.3 |
86.4 |
|
|
Primary Energy Supply |
81.3 |
84.0 |
92.4 |
106.3 |
126.3 |
151.0 |
169.5 |
282.2 |
|
|
(Mtoe) (TWh) |
|||||||||
|
134.3 |
166.4 |
199.6 |
241.7 |
278.3 |
352.2 |
407.2 |
543.9 |
||
|
Final Energy demand (Mtoe) |
60.5 |
79.0 |
74.2 |
83.5 |
99.4 |
118.0 |
131.1 |
224.0 |
|
|
Installed capacity (MW) |
27,264 |
35,59 |
36,824 |
41,817 |
48,694 |
61,622 |
71,47 |
96,35 |
|
|
Electricity supply (TWh) |
128,3 |
141.2 |
161.0 |
190.7 |
242.0 |
306.1 |
356.2 |
499.5 |
|
|
Per capita (kWh) |
1,903 |
1,997 |
2,09 |
2,546 |
3,106 |
3,797 |
4,328 |
5,781 |
|
This all too brief summary of contemporary energy sources, production and consumption in Turkey should serve as realistic background against which to focus on a SWOT analysis of Turkey's energy politics in relation to the environment.
4. Energy and Environment
Climate change is one of the greatest threats facing the planet. Some greenhouse gases such as carbon dioxide occur naturally, emitted to the atmosphere through natural processes and human activities. Other greenhouse gases are created and emitted solely through human activities, primarily produced by the combustion of fossil fuels.
SWOT (strengths, weaknesses, opportunities and threats) analysis is widely used effective tool to realistically identify and assess the strategic situation and options for organizations as shown by Rowe et al (1994) . In this study, the characteristics of Turkey's energy politics are analyzed from the environmental aspect, breaking down the strengths, weaknesses, opportunities and threats below:
The Strengths:
- The Kyoto protocol was signed by Turkish government
- - Non-profit organizations are more sensitive to environmental issues, working to raise people's consciousness about this topic
- - New energy policies for adding renewable sources to the actual energy supply system have been brought into practice
- - During the past few years new renewable energy projects have increased, and this trend is likely to continue. This has a positive impact on reducing the hazardous impact of fossil energy sources on the environment
The Weaknesses:
- - Energy dependency on foreign countries, especially for natural gas and petrol
- - The increasing use of domestic lignite
The Opportunities:
- - Turkey has a wealth of significant potential renewable energy sources, especially in wind and solar
- - Turkey has in the past and will continue to participate in and cooperate with various networks from other countries that signed the Kyoto Protocol, and to benefit from their expertise and experience. Both scientists and policy-makers, by interacting with a wide range of people who are attempting to control greenhouse gas emissions, can efficiently learn about which approaches work and are worthwhile pursuing in Turkey
The Threats:
- - Anticipation of higher usage of fossil fuels, especially in for heating and transportation: an increase of greenhouse gas emissions.
- - New nuclear plant project very close to an earthquake fault line.
- - Citizens not sufficiently aware of the looming energy and environment problems.
What must be done:
- - The research budgets for renewable energy projects should be increased,
- - Several alternative biological materials can be used as a substitute of petrol. The most important are vegetable oils, cereals and organic waste material,
- - The share of renewable energy in production/consumption must be increased.
5. World Electricity Production
The world's electricity production was 20.055 TWh, and 40.6% which obtained from coal, 21.4% from natural gas, 16.2% from hydroelectric, 13.4% from nuclear, 5.1% from oil and 3.3% from renewable ressources according to data for the year 2009 (Web-7). Depending to the key world energy statistics, the world electricity production from fossil fuels by country can also be categorized as below (table 2):
In the world, although the value of renewable energy used in electricity generation grows, the share of fossil fuels continues to increase (Saygın et al., 2010). In figure 3, this fact of the evolution of world's electricity generation by fuels can also been seen.
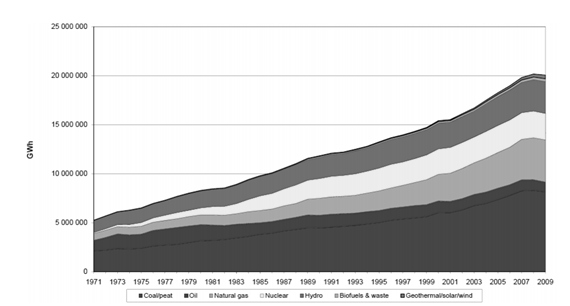
Table 2. World's electricity production from fossil fuels.
|
Natural gas |
TWh |
Oil |
TWh |
Coal/peat |
TWh |
|
United States |
950 |
Saudi Arabia |
120 |
People of Republic of China |
2913 |
|
Russian Federation |
469 |
Japan |
92 |
United States |
1893 |
|
Japan |
285 |
Islamic Republic of Iran |
52 |
India |
617 |
|
United Kingdom |
165 |
United States |
50 |
Japan |
279 |
|
Italy |
147 |
Mexico |
46 |
Germany |
257 |
|
Islamic Republic of Iran |
143 |
Iraq |
43 |
South Africa |
232 |
|
Mexico |
138 |
Kuwait |
38 |
Korea |
209 |
|
India |
111 |
Pakistan |
36 |
Australia |
203 |
|
Spain |
107 |
Indonesia |
35 |
Russian Federation |
164 |
|
Thailand |
105 |
Egypt |
30 |
Poland |
135 |
|
Rest of the world |
1681 |
Rest Of the world |
485 |
Rest of the world |
1217 |
|
World |
4301 |
World |
1027 |
World |
8119 |
The major producers, net exporters and net importers of electricity are given in the table 3 and 4.
Table 3. Major producers of electricity.
|
Producers* |
TWh |
% of world total |
|
United States |
4165 |
20.8 |
|
People's Rep.of China |
3696 |
18.4 |
|
Japan |
1041 |
5.2 |
|
Russian Federation |
990 |
4.9 |
|
India |
899 |
4.5 |
|
Canada |
603 |
3.0 |
|
Germany |
586 |
2.9 |
|
France |
537 |
2.7 |
|
Brazil |
466 |
2.3 |
|
Korea |
452 |
2.3 |
|
Rest of the world |
6620 |
33.0 |
|
World |
20055 |
100.0 |
*Gross production minus production from pumped storage plants
Table 4. Net exporters and Importers of electricity.
|
Net exporters |
TWh |
Net exporters |
TWh |
|
Paraguay |
45 |
Italy |
45 |
|
Canada |
34 |
Brazil |
40 |
|
France |
26 |
United States |
34 |
|
Russian Federation |
15 |
Finland |
12 |
|
Czech Republic |
14 |
India |
10 |
|
Germany |
12 |
Hong Kong(China) |
8 |
|
People's Rep. of China |
11 |
Argentina |
6 |
|
Norway |
9 |
Croatia |
6 |
|
Spain |
8 |
Iraq |
6 |
|
Ukraine |
6 |
Hungary |
6 |
|
Others |
50 |
Others |
68 |
|
World |
230 |
World |
241 |
6. Turkey Electricity Production
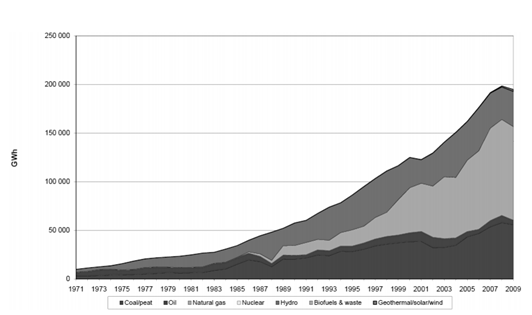
Turkey's electricity production in 2009 was 194813 GWh, and the source of the production is as follows; 28% from coal, 49% from natural gas, 18% from hydroelectric, 3% from oil and 2% from renewable ressources (Web-8).
As seen in figure 4 (Web-8), Turkey electricity's generation has a growing trend. On the demand side, industrialization has a great part on this fact. In the next section, we investigate on Turkish industrial electricity consumption, losses and leaks in electricity and possible savings.
7. Turkish Industrial Electricity Consumption
In Turkey, energy consumption of 2.165 kWh per capita is about one-fifth of the average consumption of OECD countries. Nevertheless, Turkey's energy density with 0,27 TEP is twice that of OECD counties in 2009. The bottom line here is that in Turkey every dollarof goods or services produced uses twice the amount of energy used in OECD countries.
Energy efficiency problems have many aspects. One of the most important of these is lost and leaking electricity, which has an immense negative effect on energy efficiency. Looking at net electricity consumption (MWh) in Turkey for the year 2009, it is apparent from the distribution shown in figure 3, of 70.470.076 MWh/year, that industry is by far largest factor in consumption (Web-10).
The role of loss and leaks in the electricity flow in this time frame was non-negligible. In Turkey the electricity is owned by public, namely TEDAŞ along with private companies. In figure 4, the losses and leaks in the electricity consumption are also evident,17.7% (MWh) from TEDAŞ (23 033 130/ 106 755 880) and 6.5% (MWh) from private companies as being lost or leaked. These losses and leaks in the spine of the electricity grid are a strong obstacle to the country's goal of efficient usage of energy.
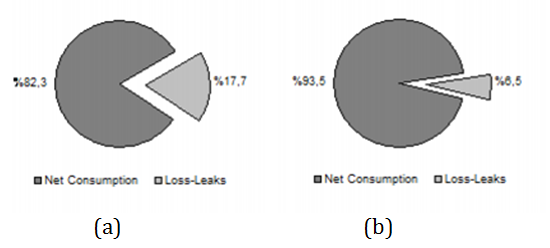
(b) Private companies percentage of loss and leaks.
We aimed here to show the annual savings in the Turkish industrial sector that derive from energy efficient politics. In literature, there is another report undertaken by the Turkish State Planning Organization (DPT) that used data in Toe (The tonne of oil equivalent ) unit to calculate energy consumption in 2001 (Kavak K.2005). In our study we focused on Turkish Industrial electricity consumption, reporting our finding in the Table 5.
We first gathered from TEDAŞ annual statistics documentation for sectoral electricity consumption (MWh) for the year 2009. We then obtained possible savings rates (%) from the Electrical Works Study Administration (EIEI); they were determined by EIEI experts with many years of experience. Using industrial electricity consumption (MWh) in 2009 with the rates of possible sectoral savings given by EIEI, we calculated possible sectoral savings quantities (MWh). Finally, we calculated provision for monetary savings from the measures of possible sectoral savings and sectoral electricity cost (0,1158 $/kWh). We found that that there is a possible energy savings of 2.349.748.124 $ from the sub-sectors of industry for one year. This rigorously determined estimation shows that industrial energy efficiency implementation may help motivate enterprises to participate in the sustainable development movement and conceivably save millions of dollars.
Table 5. Possible energy savings for the sub-sectors of industry.
|
|
2009 Industrial Electricity |
Possible Sectoral |
Possible Sectoral |
Provision for |
|
|
Consumption (MWh) |
Savings Rate (%) |
Savings Quantity (MWh) |
Monetary Savings ($) |
|
Provisions Industry |
4.916.138 |
20 |
983.227 |
113.857.756 |
|
Textile,Apparel and Leather Industry |
12.008.357 |
25 |
3.002.089 |
347.641.906 |
|
Forest and paper products Industry |
3.471.923 |
25 |
867.980 |
100.512.084 |
|
Chemical-Oil and Plastics Industry |
6.942.327 |
25 |
1.735.581 |
200.980.279 |
|
Stone and Land based Industry |
9.672.708 |
10 |
967.270 |
112.009.866 |
|
Iron-Steel Metal Industry |
16.000.294 |
35 |
5.600.102 |
648.491.811 |
|
Non-metallic Iron-Steel Industry |
1.924.409 |
35 |
6.735.431 |
779.962.909 |
|
Machinery and Equipment Industry |
3.997.547 |
10 |
399.754 |
46.291.513 |
|
TOTAL |
58.933.703 |
- |
20.291.434 |
2.349.748.124 |
8. Conclusion
In this study we firstly examined contemporary patterns of world energy production and comsumption with a focus on the Turkish energy sector. After delineating the positive and negative environmental impacts of the different kinds of energy source, we focused on an SWOT analysis to see Turkey's energy politics in relation with the environment. The key factors of a sustainable energy politics are promoting growing energy efficiency, ensuring the diversity of energy technology and adding renewable sources to the energy supply system. The focus was on possible energy and cost savings that might be realized by an efficient energy system. We used reports about Turkey's industrial electricity consumption in our calculations, showing that with an improvement in industrial energy system there is a possible energy savings of 2.349.748.124 $ yearly from certain sub-sectors. This determined estimation shows that industrial energy efficiency implementation may help motivate countries and enterprises to participate in the sustainable development movement.
Acknowledgements
The author wishes to acknowledge the support by Galatasaray University Research Foundation.
References
Kavak, K. (2005). Energy efficiency worldwide and in Turkey,
Kaygusuz, K. (2002).Environmental impacts of energy utilisation and renewable energy policies in Turkey. Energy Policy,30, 689–698. View Article
ISBN 975 – 19 – 3782-5, Thesis in Turkish State Planning Organization.
Ocak, M., Ocak, Z, Bilgen, S., Keles, S., Kaygusuz, K.(2004). Energy utilization, environmental pollution and renewable energy sources in Turkey. Energy Conversion and Management,45,845–864. View Article
Rowe, A. J., Mason, R. O., Dickel, K. E., Mann, R. E. B., Mockler, R. J. (1994). Strategic Management: A Methodological Approach. 4th Edition, Addison-Wesley. Reading Massachusetts.
Saygın, H., Çetin, F. (2010) Recent New Energy Paradigm and Renewable Energy: Turkey's Vision. Insight Turkey, Volume 12, Number 3, pp. 107–128. View Article
Website References
BP Global, Consluted on 15 February 2011 View Website
U.S Energy Information Administrator, Consulted on 18 February 2011 View Website
U.S Energy Information Administrator, International Energy Outlook 2011, Consulted on 18 February 2011 View Website
Ministrry of Energy and Natural Resources, Consulted on 16 February 2011; 18 February 2011 View Website
REN21: Renewable Energy Policy Network for the 21stCentury, Consulted on 15 January 2011View Website
Turkish Electricity Transmission Corporation, Consulted on 10 December 2011; Consulted 13 January 2012, Accessed on 15 January 2012 View Website
IEA: International Energy Agency, Consluted on 12 January 2012 View Website
IEA: International Energy Agency: Statistics, Accessed on 15 January 2012 View Website