International Journal of Environmental Pollution and Remediation (IJEPR)
ISSN: 1929-2732

Volume 1 - Year 2012 - Pages 31-37
DOI: 10.11159/ijepr.2012.005
Water Monitoring of Paraíba do Sul River in the City of Lorena – SP, Brazil
Adriana Cosentino Garcia¹, Diovana Aparecida dos Santos Napoleão², Adriano Francisco Siqueira², Helcio José Izário Filho³
¹Engineering School of Lorena, University of São Paulo - Campus I
Estrada Municipal do Campinho s/n CEP 12602810 - Lorena – SP - Brazil
adrianagarcia@alunos.eel.usp.br
²Basic Sciences and Environmental Department,
Engineering School of Lorena, University of São Paulo - Campus I
Estrada Municipal do Campinho s/n CEP 12602810 - Lorena – SP - Brazil
diovana@debas.eel.usp.br; adriano@debas.eel.usp.br
³Chemical Engineering Department,
Engineering School of Lorena, University of São Paulo - Campus I
Estrada Municipal do Campinho s/n CEP 12602810 - Lorena – SP - Brazil
helcio@dequi.eel.usp.br
Abstract - In this paper, pH parameters, temperature, dissolved oxygen (DO), biochemical oxygen demand (BOD), chemical oxygen demand (COD) and heavy metals were investigated. The evaluation was based on the collection of water from Paraíba do Sul river in the region of Lorena city (São Paulo – Brazil), close to Engineering School of Lorena from October 2011 to August 2012. It was verified that the results presented are compatible with researches done previously. From statistical analysis it was verified that the obtained results for DO oscillated around at the 5 mg O2 L-1, presented DO concentration levels below the limit established by National Environment Board (CONAMA nº.357/2005) in 40% of the analyzed days. A preliminary data assemblage collected in the period of studies is presented to demonstrate the application of the used methods.
Keywords: Hydric Pollution, Monitoring, Water Quality Indexes, Paraíba do Sul River
© Copyright 2012 Authors - This is an Open Access article published under the Creative Commons Attribution License terms. Unrestricted use, distribution, and reproduction in any medium are permitted, provided the original work is properly cited.
1. Introduction
The pollution, the inappropriate use and the lack of planning of urban and industrial places restrict the amount of water available for the human consumption. This scarcity, increasing even more, foretells the matter of water as one of the most serious problems of the human kind in the 21st century. One of the main pollutant sources of water consists of the throwing of effluents, in particular, from domestic and industrial sewers. These effluents usually don't receive any kind of adequate treatment, producing a pollutant load, making the rivers not always able to absorb them and, compromising their quality (Araújo et al.,2007).
As well as in many rivers spread all over the world, the Brazilian rivers are found extremely impelled and among them, Paraíba do Sul river, mainly due to its localization between the axis Rio – São Paulo, connection and development vector of one of the most important economical regions of South America. From it, every day, around five millions of m3 of water is extracted for human consumption. The water used by the industrial sector is equivalent to half of this amount, that is, around 2.5 millions of m3/day. About 14 million people depend directly on the water basin of Paraíba do Sul river, including 90% of the population from Rio de Janeiro.
Having in view the importance of Paraíba do Sul river, in which its drainage basin covers three States (São Paulo, Rio de Janeiro and Minas Gerais), it becomes necessary the water quality monitoring and maintenance, as according to Marotta et al. (2008), the anthropogenic increase of nutrient concentrations, mainly nitrogen and phosphorus, promote the eutrophia of water ecosystems. Put in this contexture, it's a matter of great concern to carry out analyses to evaluate the physicochemical and biological peculiar qualities of the water in Paraíba do Sul river, recognizing the pollution level and the impacts caused to the environment, which modify the water quality and the population's way of life.
Aligned to these principles, several papers try to present their results related to the physical, chemical and biological monitoring in drainage basins, in particular in Paraíba do Sul river. According to the studies accomplished by Bernardi et al. (2001), which made it possible to analyse the impact of the effluent emissions in Paraíba do Sul river, close to Pindamonhangaba city (São Paulo – Brazil), making use of the surface tendency analysis, by polynomial regression and multivaried statistical method of pivotal components, diagnosing the spatial distributions, its importance and the magnitude of the impact caused in the planktonic community. Another study was proposed by Togoro and Marques (2007), who presented the tendency of the fall of the water quality through analyses of some variables such as pH, conductivity, DO, BOD, COD, nitrate, nitrite and fecal coliforms in the fluminense stretch of the river, area which is very changed, as the result of a long degradation process, factor which endangers the water quality. Margina et al. (2008) put into practice analyses of automatic monitoring systems in Paraíba do Sul river in the paulista stretch among the cities of Jacareí, Guaratinguetá and Cruzeiro (São Paulo – Brazil), for the acquisition of data related to the changes in the water quality, inclusively at night. Arias et al. (2008) used bioindicators to evaluate the environmental impact, so that the level of chemical substances in the environment are not enough to reveal the real adverse effects of the contamination, making necessary the evaluation of the biological effects without several hierarchical levels.
The purpose of this paper was the realization of the physical and chemical water monitoring in Paraíba do Sul river in a defined point at School of Engineering of Lorena (USP) located in the city of Lorena (São Paulo – Brazil). From the results of the monitoring analyses in Paraíba do Sul river, a statistical pattern was applied which evaluated some pollution variability patterns of the receiving water body.
2. Materials and Methods
2.1 Samples Collection
The water samples from Paraíba do Sul river were collected in the morning (08h00min) once a week in appropriate and previously rinsed bottles, in a point of the border close to the School of Engineering of Lorena. The recipient for the samples collection was manually thrown in the river in the defined point, being collected, on average, three liters of samples weekly.
In the moment of the collection, a part of the sample was immediately transferred to three BOD flasks and reserved for the analysis of the dissolved oxygen (DO). This transference was carefully done in order to prevent the formation of bubbles in the interior of the bottle.
2.2 Hydrogenic Potential (pH) and Temperature
The pH and temperature determination was done using the potentiometric method, using a Bench pHmeter of ORP/Temperature - Model HI 2221. Its precision is ± 0.01 for pH and ± 0.2°C for the temperature (Hanna Instruments). These measures were done as soon as the samples arrived at the laboratory, taking on average 10 min between the collection and the measure.
First, the pHmeter was calibrated using the buffer patterns 5 and 7. Next, 50 mL of the sample was added in a previously rinsed becker and low agitation. The electrode was immersed in the sample, and after stabilization for reading and the measurement average values were registered.
2.3 Dissolved Oxygen (DO)
For the quantification of dissolved oxygen concentration the modified Wincker methodology was used (Lima et al., 2006).
The sample was directly collected in BOD bottles, avoiding creating air bubbles in its interior. As soon as the entire volume was occupied, the bottle was gently hit by the cap so the dissolved air was expelled from the sample. After some minutes, 2 mL of manganous sulfate solution and 2 mL of alkaline solution of iodide and azide were added, taking care so not to add them in opposite sides in order not to have reaction among them in the moment of the addition. The bottle was well shaken for complete reaction and it left to rest to decant the precipitate. After the realization of this procedure, repeating three times, 2 mL of concentrate sulphuric acid was added, shaking it again. This sample must adquir the brown color, indicating the formation of iodine. Later on, 200 mL of the sample was transferred with the help of a measuring glass for a 500 mL-erlenmeyer and titraded with standard solution of Na2S2O3 (0.25eqL-1), in the presence 1% m/v of starch solution.
2.4. Determination of Biochemical Oxygen Demand (BOD)
2.4.1. Samples Incubation
The procedure of the samples incubation depends substantially on the value of DO concentration, therewith becoming necessary the obtainment of this value before choosing the suitable procedure. For samples with DO concentrations below 5 mg L-1, about 2 liters of samples have been aerated for 2 hours in a keg, leaving it in rest for 1 hour, at 20 °C, in the incubator. The samples, in this way placed, got DO concentration enough to determine the DBO according to the methodology for samples with OD concentration higher than 5 mg L-1.
2.0 mL of ferric chloride, calcium chloride, magnesium sulphate solutions and buffer solution with pH 7.2 were added in 2 liters of sample stored in a keg. The prepared sample in the keg was transferred up to half of the BOD flask. 2.0 mL of seed solution was added, slowly, avoiding the formation of air bubbles. As soon as the entire volume was occupied, the bottle was gently hit by the cap so the dissolved air was expelled from the sample. The cap was carefully introduced in the bottle, always avoiding the bubbles imprisonment. This procedure was repeated two more times, in other two BDO bottles. Two of these bottles (A2 and A3) were put in the DBO incubator, where stayed for five days at 20 °C. In the third bottle (A1) the quantification of the concentration of DO was done, according to the procedure described before. The volumes of the incubated bottles were registered as well (A2 and A3).
After five days, the bottles A2 and A3 were removed from the incubator, and the same procedure for determination of DO was repeated. Preliminarily performed the incubation of the solution containing the nutrients which oxygen depletion average expresses the efficiency of nutrient solutions, the result of which should not exceed 0.2 mg O2/L.
Concurrently performed by incubation of seed (Polyseed–Interlab) for testing the efficiency of these microorganisms, this result must not be higher than 1.50 mg L-1 of O2.
2.5. Chemical Oxygen Demand (COD)
2.5.1. Analytical Curve with the Potassium Biphtalate Standard Solution for the Analysis of COD with Low Concentration
In order to determine the chemical oxygen demand concentration (COD) it was used the methodology Standard Methods–5220 D Closed Refflux, Colorimetric Methods (APHA-AWWA, 1998).
Initially, nine bottles were washed with distilled water and aqua regia (HCl + HNO3) and dried in a sterilizer at 100 °C for the COD analysis. In each COD bottle, about 50 mg of mercury sulfphate were weighed and in each bottle 2.50 mL of silver acid sulphate 0.67% m/v, 5 mL of the potassium dichromate solution 0.1 eq L-1 and 0.3 mL of deionized water were added. The reagents were exactly added in this order and in each addition of a reagent there was a gently agitation. In the bottles, amounts of potassium biphtalate 144 mg L-1 and distilled water were put with the help of a micropipette according to the Table 1. After the addition of the volumes the bottles were closed and shaken. Then, the bottles were put in the digester oven during two hours at 150 °C. It was observed during all the heating period, if there wasn't bubbling in the solutions in the bottles, in case of bubbles, the solutions were thrown aside from the respective bottles.
Table 1. Volume of potassium biphtalate standard solution and deionized water added in each tube for COD calibration curve with low concentration
| Tube | Volume of potassium biphtale 11 mgL-1 (mL) | Volume of deionized water |
| 0 | 0.000 | 3.000 |
| 1 | 0.250 | 1.750 |
| 2 | 0.500 | 1.500 |
| 3 | 0.750 | 1.250 |
| 4 | 1.000 | 1.000 |
| 5 | 1.250 | 0.750 |
| 6 | 1.500 | 0.500 |
| 7 | 1.750 | 0.250 |
| 8 | 2.000 | 0.000 |
After digestion and conditioning at room temperature, the absorbance measures were done in the spectrophotometer BEL Photonics 1105. The wave length was placed in 420 nm. With the measurement of absorbance of each standard became linear regression using the software Origin, whose equation was y = 0.00758 – 0.00287x with R=0.99809.
2.5.2. Determination of COD in the Samples
To determine the COD of the samples, the procedure for preparation and digestion were the same, except for the addition of 2 mL samples in natura.
2.6. Heavy Metals
All the analytical determinations of the metal members of interest in the water samples of Paraíba do Sul river were done in a spectrophotometer of atomic absorption, PerkinElmer brand, Analyst 800 model, which has an integrated system incorporating the components for the graphite and flame oven operation in a single instrument, allowing the automatic exchange of the atomization technique chosen.
In order to determine the interest elements in superficial water samples the methodology Standard Methods 3000 – Metals (APHA-AWWA, 1998) was adapted, based on the analysis of metal members via atomization by flame via atomization (Flame atomic absorption spectrometry-FAAS), to determine Ba, Cr, Cu, Mn, Ni, Sn and Zn, and analysis via eletrothermal atomizatione (Eletrothrmal atomic absorption spectrometry-ETAAS), to determine Ag, As, Cd, Hg, Pb and Se (APHA-AWWA, 1998). The lamps used to determine Hg, Cd, Se, Pb and As were EDL type (Electrodeless Discharge Lamp) and to determine Ag, Ba, Cu, Cr, Mn, Ni, Sn and Zn the lamps used were HCL type (Hollow Cathode Lamp).
3. Results and Discussion
3.1. Obtained Results of pH, Temperature, Dissolved Oxygen, Biochemical Oxygen Demand and Chemical Demand Analyses
Analyses of pH, temperature, DO, BOD and COD in water of the Paraíba do Sul river were conducted between October 2011 to August 2012. Based on the obtained results of hydrogenionic potential (pH), shown in Figure 1, it was observed that the values vary between 6.0 and 8.0 being in agreement with the limits established by CONAMA resolution number 357/2005 (pH=6.0 to 9.0) for fresh bodies of water class II. In the first months (October 2011) of analysis, it was observed that the results were slightly bigger than the value of the neutrality (pH=7.0), indicating a lightly basic pH.
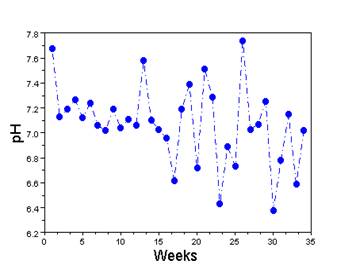
This result would be related to the presence of carbonates and bicarbonates in the water of Paraíba do Sul river, which tend to become the sample alkaline. In the following months, it was observed that the values of the pH of the water samples didn't keep a standard during the period of study, with variations in the constant results. The variations in the pH results may be related to the presence of impurities in the electrode of the pHmeter which may contain grease incrustations, avoiding a reading with appropriate precision. It may also be caused by variation in the concentration of acids and bases proceeding from industrial and even domestic sewerages.
In order to analyze the temperature in the water in Paraíba do Sul river, it was testified that during the period of study, the samples presented temperatures in a general average between 17°C and 26°C. It was observed a gradual increase in the temperature in the months of January and February 2012 these oscillations are due to the seasonal variations in the region. The seasons of the year in the period of the analyses (spring until the 3rd week in December 2011 and summer in the later months) indicate the increase in the solar radiation, what contributes to the rise in temperature in the water in the river, as shown in Figure 2.
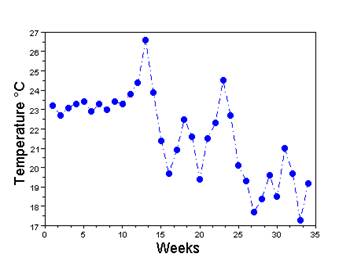
While in the following months to May 2012, the results presented a gradual reduction in the values obtained for the temperature. What may also be related to the climate in the region, in as much as in the month of June 2012 there is the beginning of the winter in the Southern hemisphere, indicating a decrease in the incidence of solar radiation. The variations in the results of the temperature may also be caused by the time interval between the collection and the measurement of the temperature with the pHmeter, because during this period the sample come into balance with the room temperature.
The analysis done in the water in Paraída do Sul river for the dissolved oxygen during the period of study, the DO concentration values were correspondent to 4.18 and 5.93 mg O2 L-1, as shown in Figure 3.
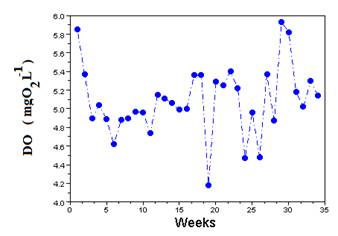
It was observed that the water samples presented some concentration values below the established limit by CONAMA resolution number 357/2005 for the class 2 rivers, where the concentration must be higher than 5 mg O2 L-1. The variations in the DO results may be related to the time interval between the collection and the addition of the manganous sulphate and the alkaline solution of iodide and azide in the BOD bottles containing the samples.
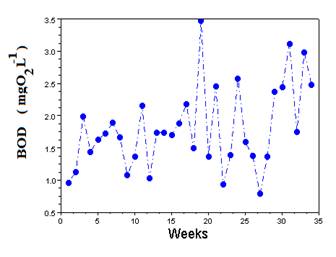
The obtained results for the biochemical oxygen demand presented values of the water samples in Paraíba do Sul river correspondent to 0.79 and 3.47 mg O2 L-1, as shown in Figure 4. It was observed that the water samples presented BOD values within the limit established by CONAMA resolution number 357/2005 which in this case, for a class 2 river is at the utmost 5 mg O2 L-1. The variations in the results may be related to problems due to in the dilution water agitation containing the PolySeed capsule from InterLab. It was observed that during the DBO analyses the intensity of agitation was reduced, because the excessive increase of it caused collisions among the microorganisms, compromising its physical and functional integrity.
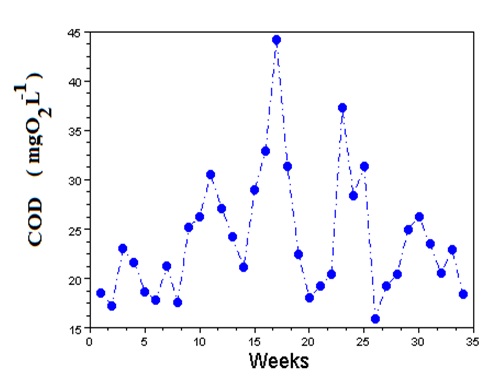
The analyses done for the COD values presented variations between 15.98 and 44.15 mg O2 L-1, as shown in Figure 5. CONAMA resolution number 357/2005 doesn't establish a limit value for the COD, not having a reference value to compare the obtained results. It's worth noting that COD higher values than the BOD ones were expected, because the dichromate has an oxidation power higher than the microorganisms, being verified in the results during the period of analysis. The variations in the COD results may be related to problems with the buckets, such as, fingerprints, grease stains and any material on the walls that might affect in a clear way the absorbance measures obtained.
3.2. Heavy Metals Analysis
For this study the analyis of the level of heavy metals was done in the water of Paraíba do Sul river in order to obtain information about the contamination in the chosen point for this study. The obtained results of this analysis are shown in Table 2, being average of triplicate with the coefficient of variation <3%.
Table 2. Results of the analyses of heavy metals in the water in Paraíba do Sul river.
| Heavy metal | Concentration | Limit Concentrationa |
| Arsenic (As) | < 4.3 mg L-1 | 0.010 mg L-1 |
| Barium (Ba) | < 2.7 µg L-1 | 0.700 mg L-1 |
| Boron (B) | < 0.3 mg L-1 | 0.500 mg L-1 |
| Cadmium (Cd) | < 0.15 µg L-1 | 0.001 mg L-1 |
| Lead (Pb) | 5.53 µg L-1 | 0.010 mg L-1 |
| Chromium (total)(Cr) | < 1.2 mg L-1 | 0.050 mg L-1 |
| Chromium (hexa)(Cr) | < 50 µg L-1 | - |
| Copper (Cu) | < 2.5 µg L-1 | 0.009 mg L-1 |
| Tin (Sn) | < 0.5 mg L-1 | - |
| Soluble iron (Fe) | < 0.1 mg L-1 | 0.300 mg L-1 |
| Fluoride (F) | 0.22 mg L-1 | 1.400 mg L-1 |
| Manganese (Mn) | < 10.3 µg L-1 | 0.100 mg L-1 |
| Mercury (Hg) | < 2.5 µg L-1 | 0.0002 mg L-1 |
| Nickel (Ni) | 0.01 mg L-1 | 0.025 mg L-1 |
| Silver (Ag) | < 0.4 µg L-1 | 0.010 mg L-1 |
| Selenium (Se) | 6.2 µg L-1 | 0.010 mg L-1 |
| Zinc (Zn) | 0.10 mg L-1 | 0.180 mg L-1 |
aCONAMA Resolution 357/2005
According to the analysis done, the presence of Barium, Lead, Fluoride, Nickel, Silver and Zinc in the water in Paraíba do Sul river was detected. All the results obtained are found below the established limits by CONAMA resolution number 357/2005 for a glass of fresh water Class II.
For this analysis significant concentrations weren't found of the pollution indicators by toxic substances in the water in Paraíba do Sul river.
3.3. Validations of the Methodology for the Analysis of Metals
After spectrometric determination of the interest elements in the water samples in Paraíba do Sul river it was obtained the results shown in Table 3.
Table 3. Performance characterization for the validation of spectrometric methods by atomic absorption for the quantification of elements in superficial water.
| Element | Quantification Limit2 | Recovery (%) |
Linearity mg L-1/ Correlation (R2) |
|
|
Flame (mg L-1) |
Graphite oven m0(pg)1 | |||
| Ag As | - - | 4.10 42.50 | 98.30±0.4 95.50±0.3 | 0-0.05/0.992 0-0.08/0.995 |
| B | 0.303 | - | 98.20±0.2 | 0-5.00/0.997 |
| Ba | 1.50 | 27.3 | 95.00±0.6 | 0-10.00/0.993 |
| Cd | - | 1.50 | 102.10±2.3 | 0-0.100/0.994 |
| Cr | 0.25 | 12.5 | 103.30±1.5 | 0-5.00/0.998 |
| Cu | 0.26 | - | 97.90±0.9 | 0-3.00/0.998 |
| Hg | - | 25.504 | 91.40±0.8 | 0-0.05/0.975 |
| Mn | 0.15 | 10.3 | 99.50±1.0 | 0-2.00/0.998 |
| Ni | 0.40 | - | 98.30±0.6 | 0-2.00/0.999 |
| Pb | - | 32.90 | 93.60±0.9 | 0-0.50/0.987 |
| Se | - | 62.40 | 91.00±1.3 | 0-0.10/0.975 |
| Sn | 8.50 | - | 95.20±1.7 | 0-15.00/0.990 |
| Zn | 0.05 | - | 96.60±0.5 | 0-2.00/0.989 |
| Fe | 0.1 | - | 93.7±2.0 | 0-5.0/0.995 |
1Concentration characteristic; 2Considered three times the detection limit; 3Spectrophotometry; 4 After extraction
Evaluating the results in Table 3, it was observed that the doping and recovery test varied from 91.0 to 103.3 % for the elements mercury and chromium, respectively. These recovery percentage values show good analytical accuracy combined with the precision (low deviation with values < 3 %). The quantification limits are coherent with the literature data, with good correlation of the analytical curves, presenting reliability in the analytical methodology to determine the metal members by spectrometry and spectrofotometry.
3.4. Statistical Analysis of the Results
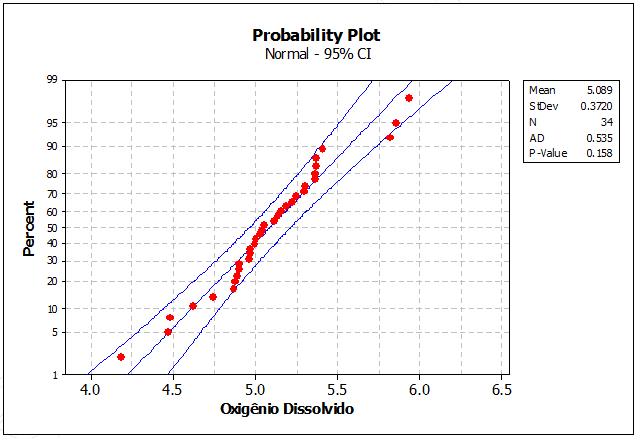
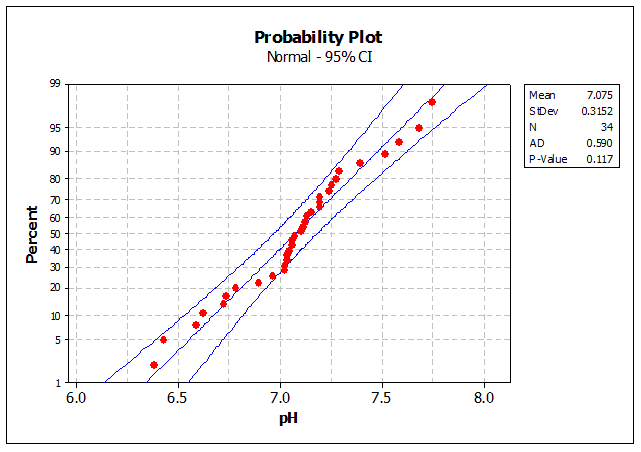
In this study a statistical analysis was done using the normal distribution for the studied parameters. According to the study done it was observed that the DO and pH parameters may be adjusted according to the Normal Distribution Hypothesis, as shown in Figures 6 and 7.
Considering the real Normal Distribution Hypothesis for the OD concentration, we can estimate the probability of this parameter be smaller than the one established by CONAMA resolution number 357/2005. So the calculation was 0.4, that is, in a 100 days, we should expect that in 40 days, the DO value would be below the legal limit established CONAMA resolution number 357/2005, indicating the existence of organic pollution in the water in Paraída do Sul river
4. Conclusion
According to the analyses done in the water in Paraíba do Sul river the pH, BOD, COD parameters, temperature and heavy metals were presented within the limits established by Conama resolution number 357/2005.
It was verified that the values determined for the DO are below the minimum value established by Conama Resolution number 357/2005. However, the BOD values are within the limits established, considering the fact that Paraíba do Sul river crosses some city (Potim, Aparecida and Guaratinguetá, state of São Paulo), which don't have integral treatment of their sewages, jeopardizing the city of Lorena. The BOD value was kept within the limits established, because the surplus of the organic matter occurred. If this surplus of organic matter weren't consumed, the increase in the BOD value would happen and the DO concentration would decrease significantly, because there were consumption of dissolved oxygen in the water in the river.
It was verified that the obtained results for DO, from a statistical analysis, oscillated around an OD=5.0 mg O2 L-1 level, adjusting the Standard Normal distribution analysis. Throughout this analysis it was proved that the water in Paraíba do Sul river presented DO concentration levels below the limit established by Conama resolution number 357/2005 in 40 % of the analyzed days. Heavy metals concentration values higher than the limits established by Conama resolution number 357/2005for heavy metals analysis weren't registered for Class II fresh water bodies.
Acknowledgements
The authors thank Santander Bank - Pro-Rectory of Research of University of São Paulo for the financial support for the accomplishment of this project. The Hydric and Environmental Analysis Laboratory, Basic Sciences and Environmental Department – LOB at Engineering School of Lorena which contribuited to the working up of this project.
References
APHA-AWWA. Standard methods for examination of water and wastewater. 20 ed Washington DC: American Public Health Association – American Water works association, 1998.
Araújo, L. M. N., Morais, A., Boas, M. D. V., Pereira, V. S. A., Sales, A. N., Araújo, F. A. (2007). Estudo dos principais parâmetros indicadores da qualidade da água na bacia do rio Paraíba do Sul. In: XVII Simpósio Brasileiro de Recursos Hídricos, São Paulo- SP. View Article
Arias, A. R. L., Inácio, A. F., Novo, L. A., Alburquerque, C., Moreira, J. C. (2008). Multibiomarker approach in fish to assess the impacto f pollution in a large Brazilian river, Paraiba do Sul. Environmental Pollution, 156, 3, 974-979. View Article
Bernardi, J. V. E., Fowler, H. G., Landim, P. M. B. (2001). Um estudo de impacto ambiental utilizando análises estatísticas espacial e multivariada. Holos Environmental, 1, 2, 162-172. View Article
Conselho Nacional de Meio Ambiente, resolução CONAMA n° 357, de 17 de março de 2005. Dispõe sobre a classificação dos corpos de água e diretrizes ambientais para o seu enquadramento, bem como estabelece as condições e padrões de lançamento de efluentes, e dá outras providências. View Article
Lima, L. S., Izário Filho, H. J., Chaves, F. J. M. (2006). Determinação de demanda bioquímica de oxigênio para teores ≤ 5 mg L-1 O2. Revista Analytica, 25, 52-57. View Article
Margina, F. C., Reis, B. J., Alves, M. L., Santos, R. J. T. P. (2008). Monitoramento da qualidade da água do rio Paraíba do Sul. In: II Simpósio de Recursos Hídricos do Sul – Sudeste, Rio de Janeiro – RJ.
Marotta, H., Santos, R. O., Enrich-prast, A. (2008).Monitoramento limnológico: um instrumento para a conservação dos recursos hídricos no planejamento e na gestão urbano-ambientais. Ambiente & Sociedade – Campinas, v. XI, 1, 67-79. View Article
Togoro, E. S., Marques, M. (2007). Qualidade da água e integridade biótica: Estudo de caso num trecho fluminense do Rio Paraíba do Sul. In: 24º Congresso Brasileiro de Engenharia Sanitária e Ambiental, Belo Horizonte. 1-8.